
Are the most common cause of deaths globally, taking an estimated 17.9 million lives each year, which accounts for 31% of all deaths worldwide. Heart failure is a common event caused by Cardiovascular diseases.
It is characterized by the heart’s inability to pump an adequate supply of blood to the body. Without sufficient blood flow, all major body functions are disrupted. Heart failure is a condition or a collection of symptoms that weaken the heart.
TABLE OF CONTENTS
- IMPORTING LIBRARIES
- LOADING DATA
- DATA ANALYSIS
- DATA PREPROCESSING
- MODEL BUILDING
- CONCLUSIONS
IMPORTING LIBRARIES
LOADING DATA
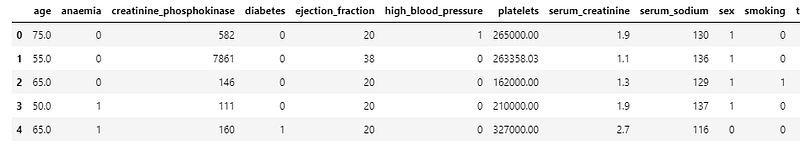
About the data:
Age: Age of the patient
anaemia: If the patient had the hemoglobin below the normal range creatinine phosphokinase: The level of the creatine phosphokinase in the blood in mcg/L
diabetes: If the patient was diabetic ejection fraction: Ejection fraction is a measurement of how much blood the left ventricle pumps out with each contraction
high_blood_pressure: If the patient had hypertension
platelets: Platelet count of blood in kilo platelets/mL
serum_creatinine: The level of serum creatinine in the blood in mg/dL
serum_sodium: The level of serum sodium in the blood in mEq/L
sex: The sex of the patient
smoking: If the patient smokes actively or ever did in past
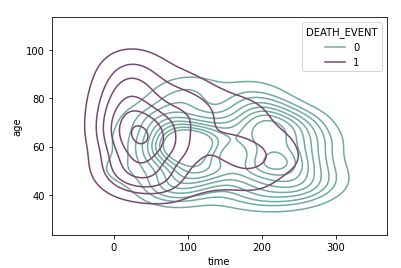
time: It is the time of the patient’s follow-up visit for the disease in months
DEATH_EVENT: If the patient deceased during the follow-up period
DATA ANALYSIS
Steps in data analysis and visualization:
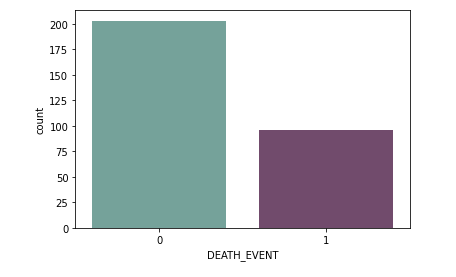
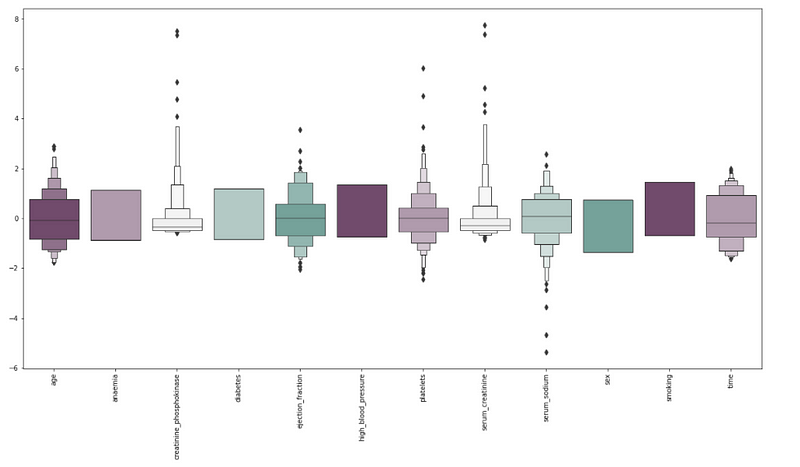
We begin our analysis by plotting a count plot of the targer attribute. A correlation matrix of the various attributes to examine the feature importance.
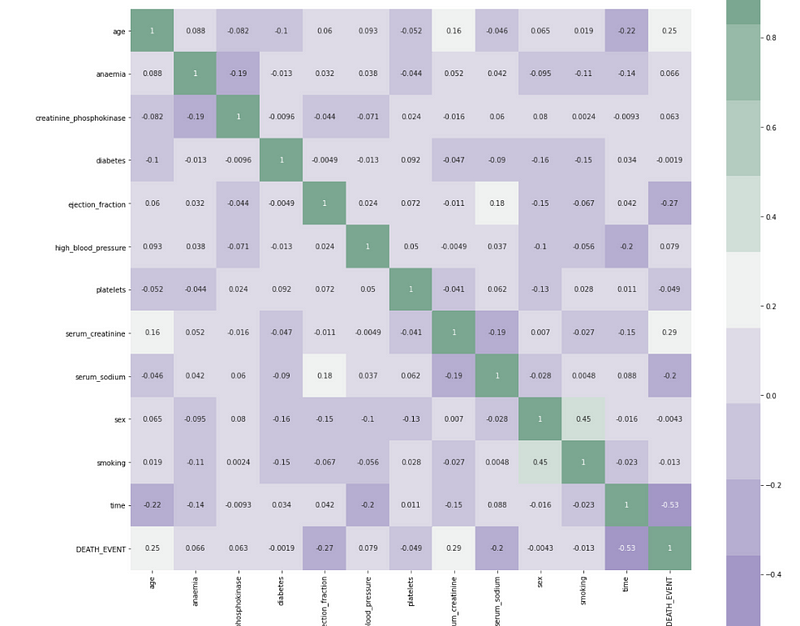
Notable points:
Time of the patient’s follow-up visit for the disease is crucial in as initial diagnosis with cardiovascular issue and treatment reduces the chances of any fatality. It holds and inverse relation.
Ejection fraction is the second most important feature. It is quite expected as it is basically the efficiency of the heart.
Age of the patient is the third most correlated feature. Clearly as heart’s functioning declines with ageing
Next, we will examine the count plot of age.
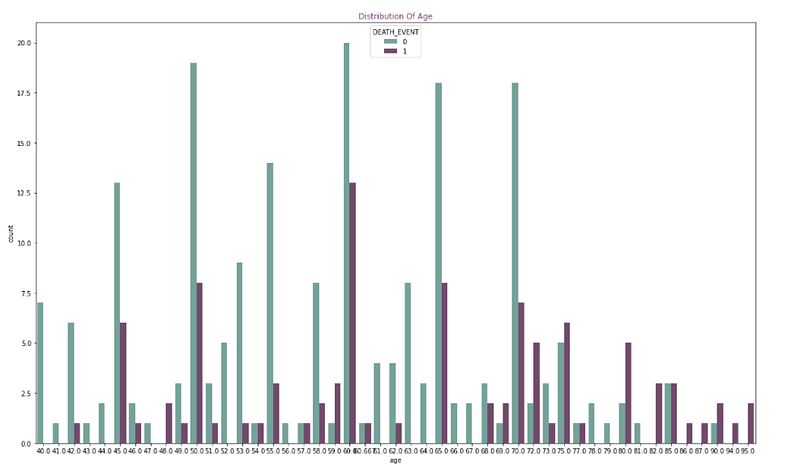
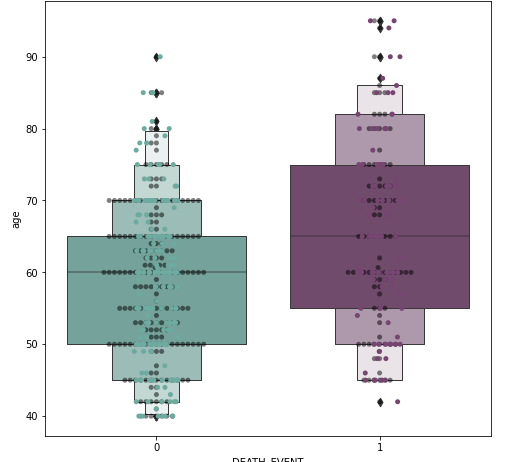
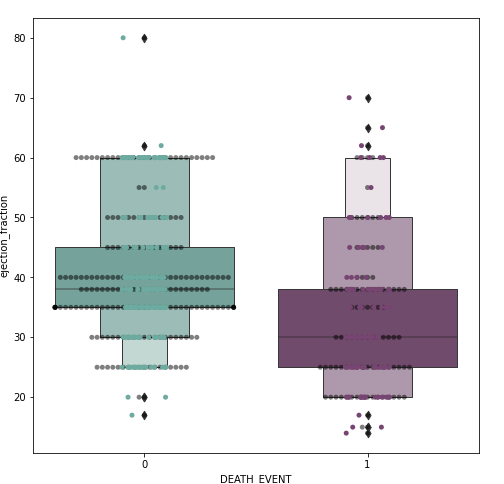
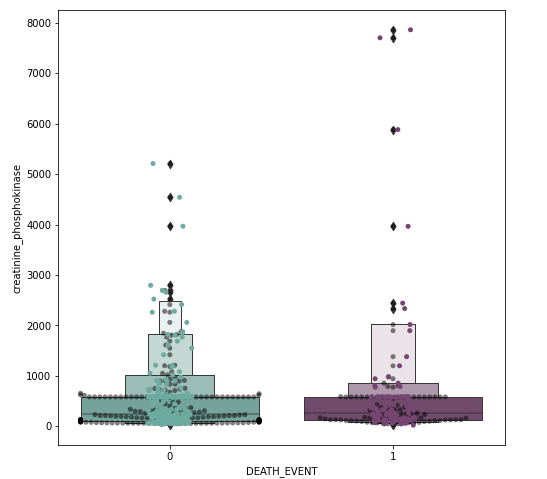
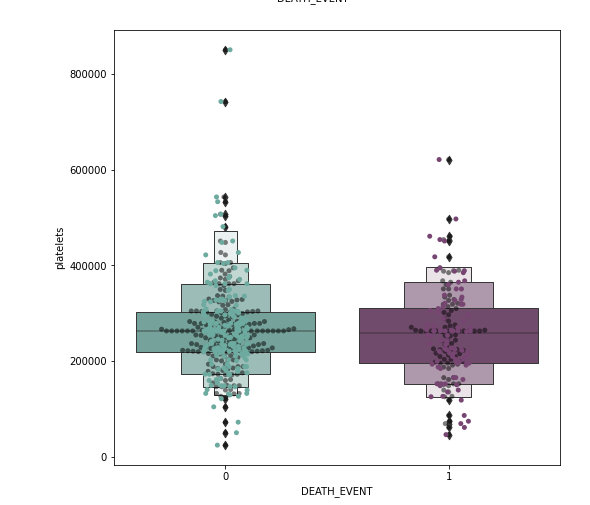
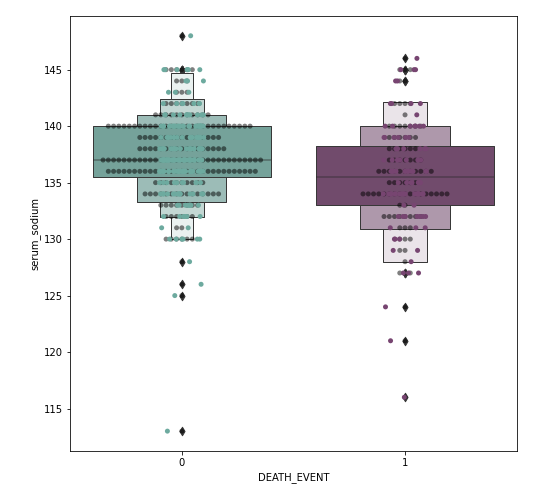
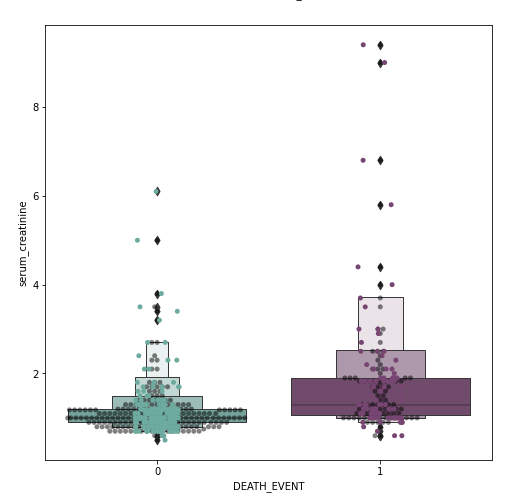
I spotted outliers on our dataset. I didn’t remove them yet as it may lead to overfitting. Though we may end up with better statistics. In this case, with medical data, the outliers may be an important deciding factor.
Next, we examine the kde plot of time and age as they both are significant features.
DATA PREPROCESSING
Steps involved in Data Preprocessing
- Dropping the outliers based on data analysis
- Assigning values to features as X and target as y
- Perform the scaling of the features
- Split test and training sets
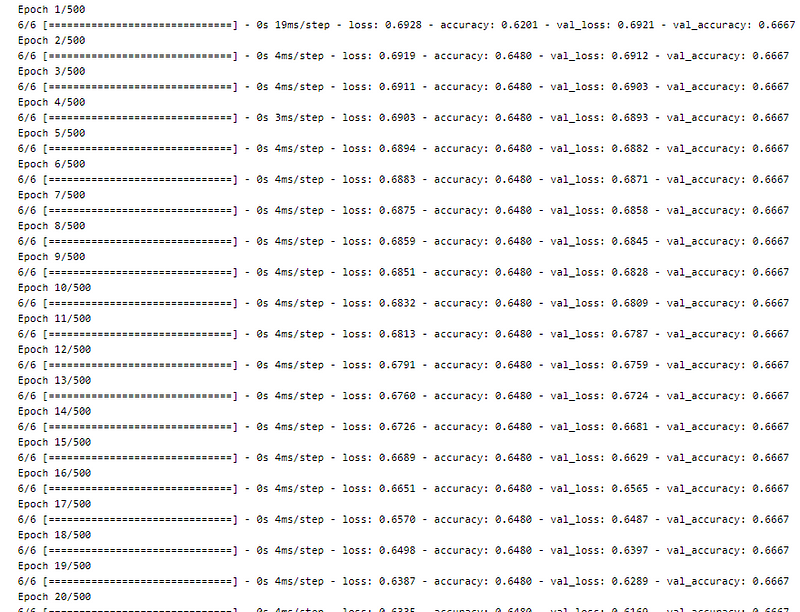
MODEL BUILDING
In this project, we build an artificial neural network.
The following steps are involved in the model building
- Initialising the ANN
- Defining by adding layers
- Compiling the ANN
- Train the ANN
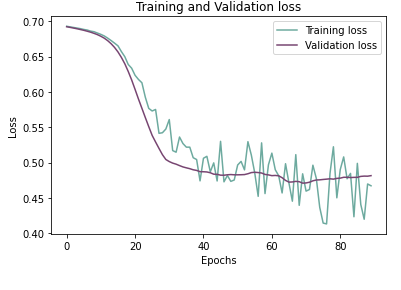
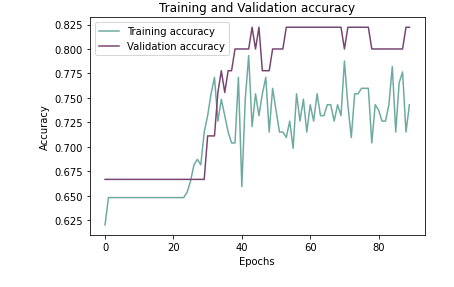
Plotting training and validation accuracy over epochs
CONCLUSIONS
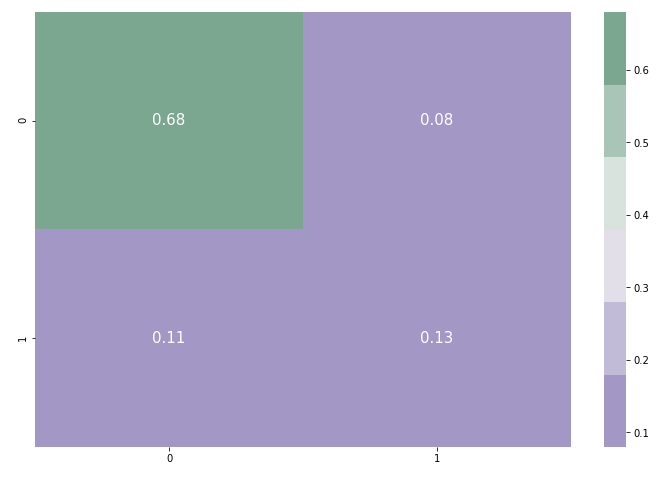
Concluding the model with:
- Testing on the test set
- Evaluating the confusion matrix
- Evaluating the classification report
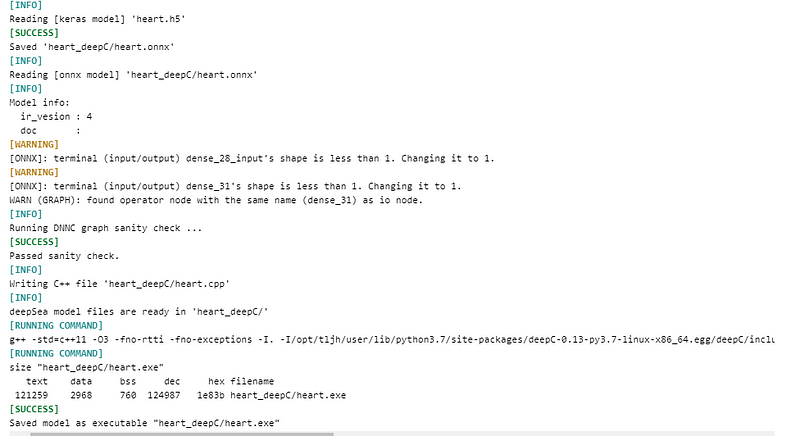
Saving the model
deep CC
Notebook Link: Here
Credit: Hrithikgupta