Mapping muscle activity data to the gestures that they result in.

Electromyography is a technique for recording and evaluating electrical activity produced in the skeletal muscles.
The readings from the muscle activity sensor are then fed to a model that can be trained on gestures, separately for each user (customization for a user) or to obtain a pre-trained model ready for direct implementation in various applications like prosthetic arms, game control, etc.
Implementation of the idea on cAInvas — here!
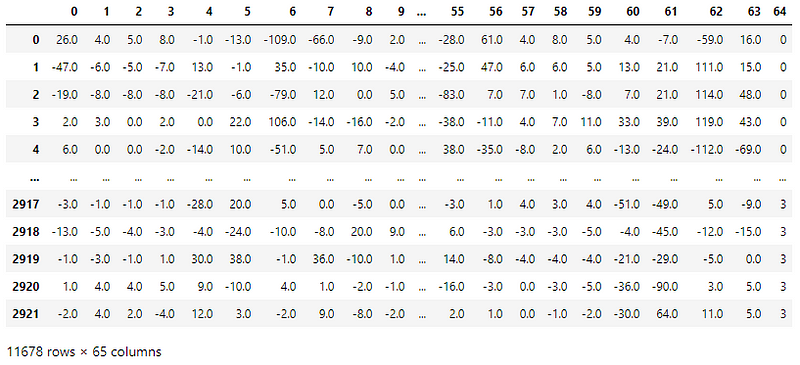
The dataset
Four different motion gestures were recorded using the MYO armband.
Each reading has 8 consecutive readings of all 8 sensors resulting in 64 columns of EMG data. The last column is the gesture corresponding to the readings.
There are 4 CSV files, one for each gesture.
A peek into the spread of class labels in the dataset —
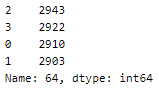
This is a fairly balanced dataset.
Understanding the distribution of values in the dataset using df.describe() function for preprocessing —
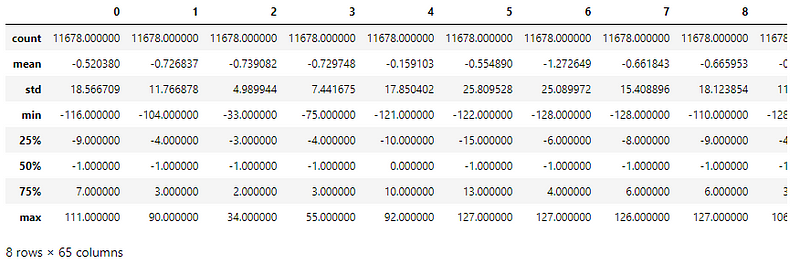
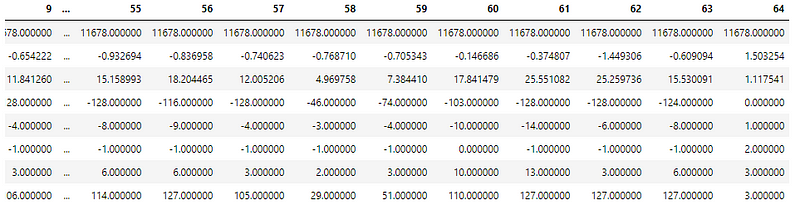
The column values have different ranges (min, max) and varying standard deviations.
These are standardized to have mean=0 and sd=1 using the StandardScaler later in the notebook.
Defining the input and output columns
The 64 readings from the muscle activity sensor are input attributes while the label is the output attribute.
The labels have no range dependency between them, i.e., 3 > 1, but it doesn’t convey any meaning with respect to the class labels 3 and 1. To avoid the model from learning any such dependency, the labels are one-hot encoded. For example, 1 → [0,1,0,0]. There are n items in the encoded list where n is the number of classes.
There are 64 input columns and 1 output column.
Using an 80–10–10 ratio to split the data frame into train-validation-test sets. The train_test_split function of the sklearn.model_selection module is used. The X and y arrays are passed to the function to get a parallel split on them.
The training set has 9342 samples, the validation and the test set each have 1168 samples.
Standardization
The standard deviation of attribute values in the dataset is not the same across all of them. This may result in certain attributes being weighted higher than others. The values across all attributes are scaled to have mean = 0 and standard deviation = 1 with respect to the particular columns.
The StandardScaler function of the sklearn.preprocessing module is used to implement this concept. The instance is first fit on the training data and used to transform the train, validation, and test data.
The model
The model is a simple one with 4 Dense layers, 3 of which have ReLU activation functions and the last one has a softmax activation function that outputs a range of values whose sum is 1 (probability values for the 4 categories).
As it is a classification problem with one-hot encoded target values, the model is compiled using the categorical cross-entropy loss function. The Adam optimizer is used and the accuracy of the model is tracked over epochs.
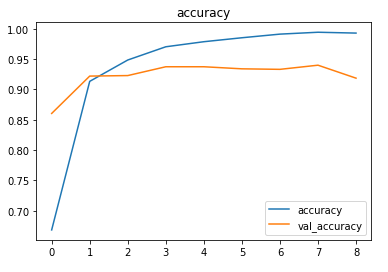
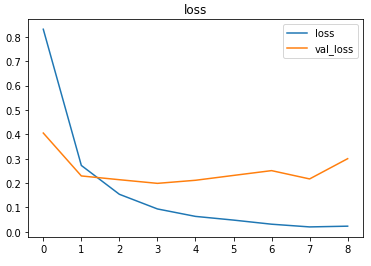
The EarlyStopping callback function of the keras.callbacks module monitors the validation loss and stops the training if it doesn’t decrease for 5 epochs continuously. The restore_best_weights parameter ensures that the weights of the model with the least validation loss are restored to the model variable.
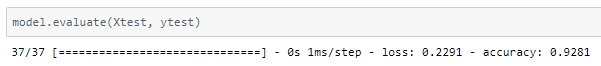
The model was trained with a learning rate of 0.0001 and an accuracy of ~92.8% was achieved on the test set.
Plotting a confusion matrix to understand the results better —
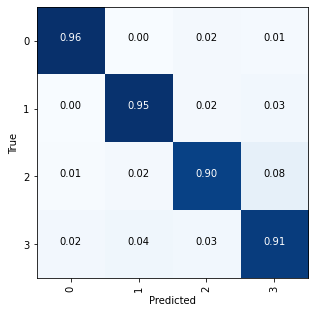
The metrics
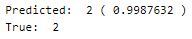
Predictions
Let’s perform predictions on random test data samples —
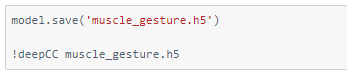
deepC
deepC library, compiler, and inference framework are designed to enable and perform deep learning neural networks by focussing on features of small form-factor devices like micro-controllers, eFPGAs, CPUs, and other embedded devices like raspberry-pi, odroid, Arduino, SparkFun Edge, RISC-V, mobile phones, x86 and arm laptops among others.
Compiling the model using deepC —
Head over to the cAInvas platform (link to notebook given earlier) and check out the predictions by the .exe file!
Credits: Ayisha D
Also Read: Classifying Clothing Items using Artificial Neural Networks on Cainvas Platform