What is this article talking about? Find out with deep learning!

How many files, documents, pdfs, articles, etc do we see every day! What are they talking about? How tiring would it be to go through an article and realize halfway that this is not what you were looking for!
On a larger scale, look at an information retrieval system. Given a topic, the system should be able to retrieve all documents/files corresponding to that topic. But on a daily basis, there will be so many articles coming in that the process of tagging the content manually becomes tiring and impossible to keep up with.
Automating this process saves time and makes it possible to keep up a large number of incoming submissions.
Implementation of the idea on cAInvas — here!
The dataset
There are two CSV files, train, and test with article titles, abstracts, and the subjects they talk about.
The articles can belong to more than 1 subject.
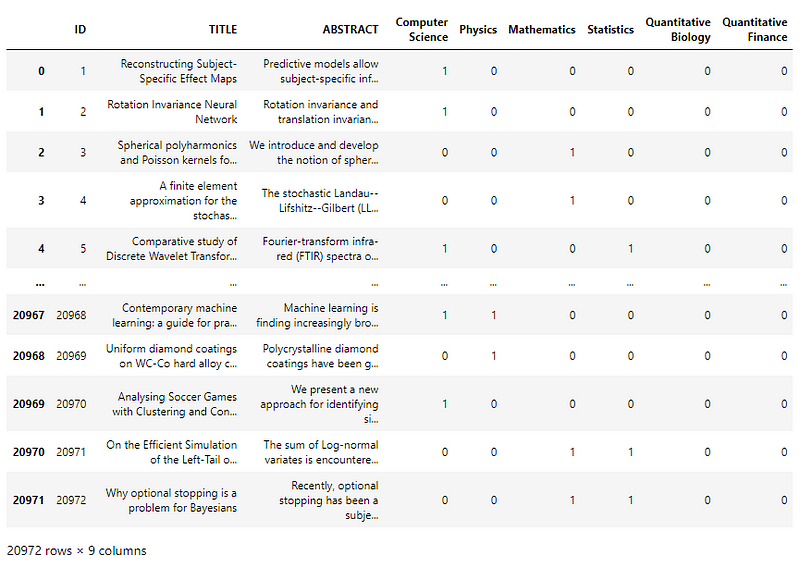
Out of the 9 columns, 6 define subjects (Computer Science, Physics, Mathematics, Statistics, Quantitative Biology, Quantitative Finance) and the other 3 are ID (redundant to index column), title, and abstract.
Let’s look into the distribution of subjects across the samples —
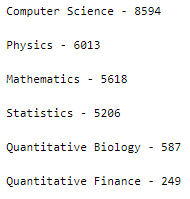
This is an unbalanced dataset. Since this is a multilabel classification problem and so resampling to equalize the distribution of subjects across the samples is not possible.
Preprocessing
Cleaning the text
To clean the text, we define two following functions, one to remove URLs and one to keep only alphabets —
The list of stop words is also defined to be used later.
The code snippet given below cleans the data frame content.
The cleaned text and the subjects are clubbed to form a single data frame.
The subject_words list holds words that appear in samples belonging to the respective subjects for visualization later.
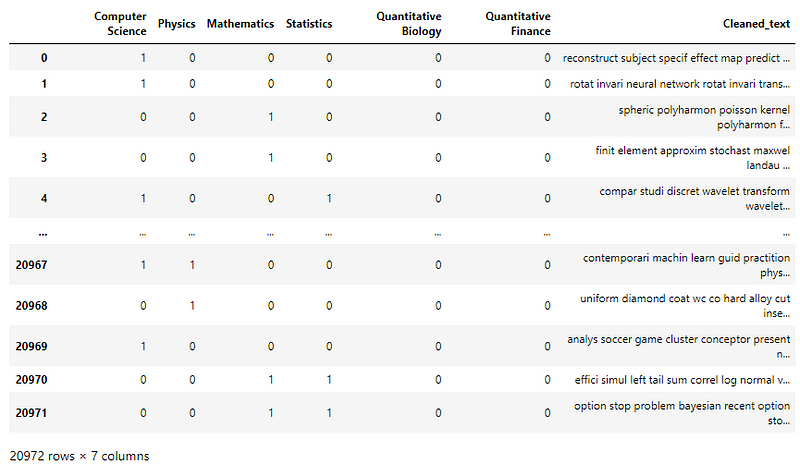
Defining the input and output columns of the data frame —
Train-test split
Splitting the dataset into train and test using 80–20 ratio.
The train set has 16777 samples and the test set has 4195 samples.
Tokenization
The Tokenizer function of the keras.preprocessing.text module is used to convert the text into a sequence of integers to give as input to the model.
Xtrain and Xtest are sparse matrices with numerical representations for each sample in the data frame.
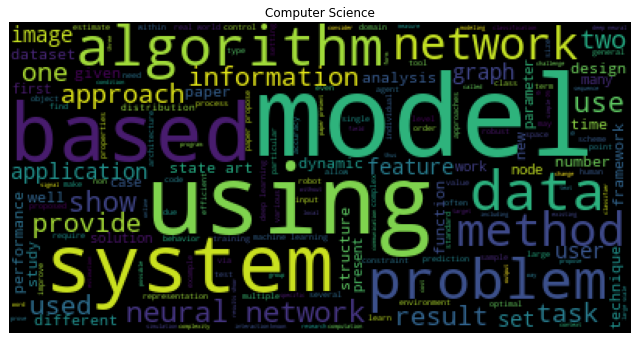
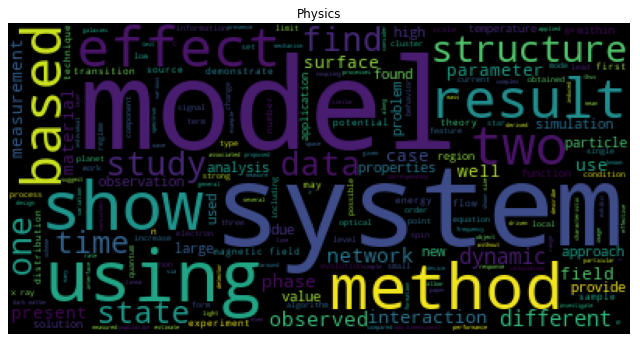
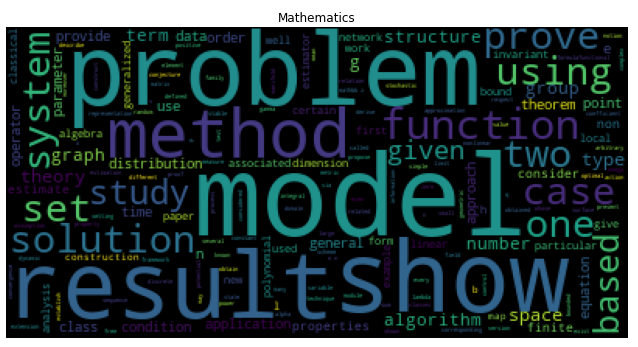
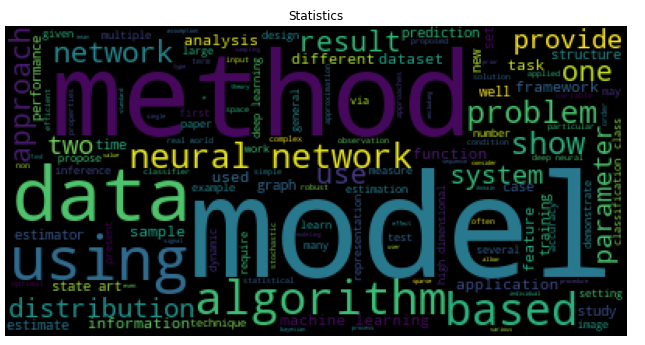
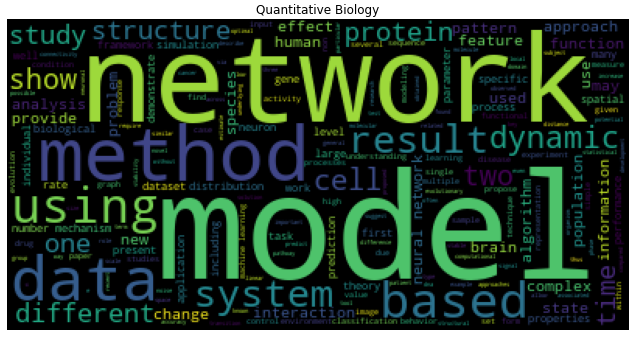
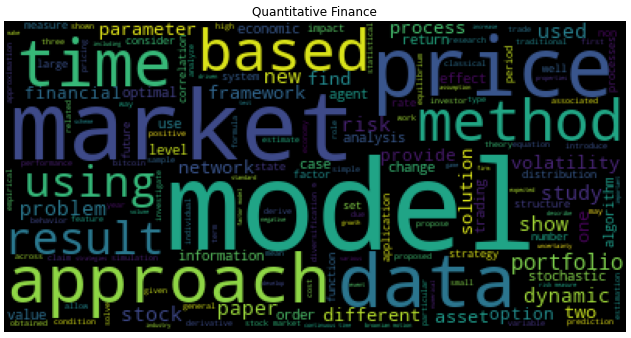
Visualization
Using WordCloud to visualize the words and their frequency in each subject.
The model
The model consists of an embedding layer that converts the input samples (that are sparse) into dense arrays of fixed size. This is followed by GlobalAveragePooling1D and two Dense layers.
The model is compiled using the BinaryCrossentropy loss as it is a multilabel classification problem and thus each category happens to be a binary classification problem of its own. Adam optimizer is used and the model’s accuracy is tracked.
The ModelCheckpoint callback function of the keras.callbacks module is used to store the models at some intervals allowing us to reload the model from that checkpoint for retraining or other purposes.
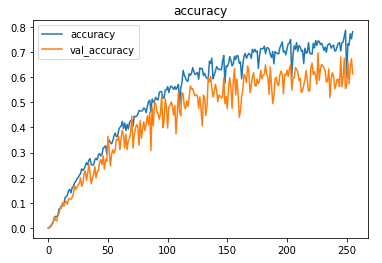
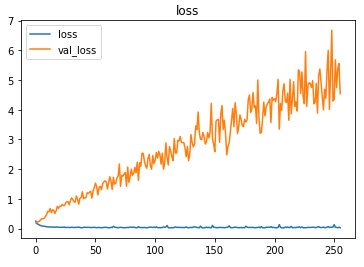
Setting the threshold value for the sigmoid activation output of the last layer of the model as 0.5 (can vary), the model achieved ~61% accuracy and F1 score of ~0.78 on the test set after training for 256 epochs with a learning rate of 0.1.
Peek into the confusion matrices for each subject (reminder, this is a multilabel classification problem that is essentially a collection of binary classification operations for each subject).
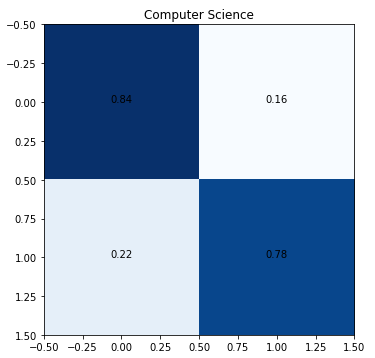
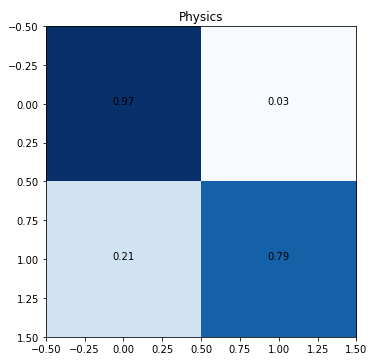
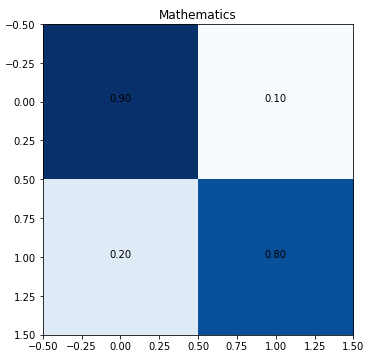
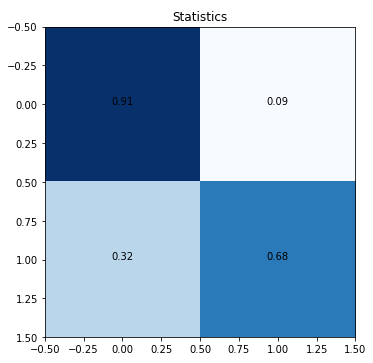
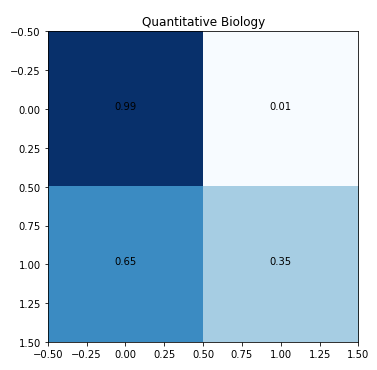
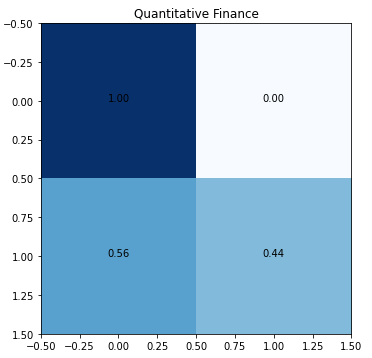
The low level of true positives for quantitative biology and quantitative finance is due to the low number of training samples.
The metrics
Prediction
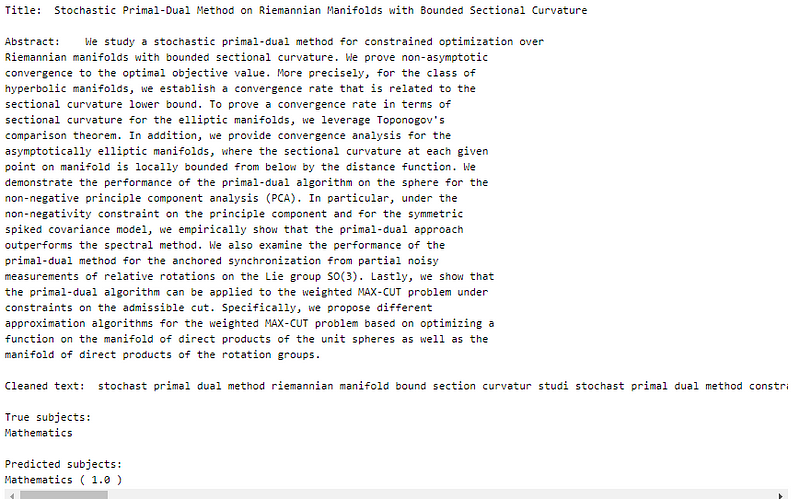
Let us perform predictions on random test samples —
The text sample is taken from the original CSV file, cleaned, tokenized, and then input to the model as an external sample would have to go through the same process.
deepC
deepC library, compiler, and inference framework are designed to enable and perform deep learning neural networks by focussing on features of small form-factor devices like micro-controllers, eFPGAs, CPUs, and other embedded devices like raspberry-pi, odroid, Arduino, SparkFun Edge, RISC-V, mobile phones, x86 and arm laptops among others.
Compiling the model using deepC —

Head over to the cAInvas platform (link to notebook given earlier) to run and generate your own .exe file!
Credits: Ayisha D
Also Read: Improving Image Resolution with Autoencoders