
Cervical cancer is a form of cancer that is found in the cells of the cervix. Upon early detection of the same, this type of cancer can be cured or its effect can be reduced up to a great extent.
The first and foremost step is to look out for a reliable platform to run our code using highly efficient GPUs. For my project, I used the Cainvas AITS Platform.
Next, we will import all the required packages necessary for the following tasks.
1. Importing the data
2. Visualizing the data
3. Pre-processing the data
4. Training on the data
5. Evaluating our performance on the trained data
Now, we will unzip the data and load the file in a DataFrame using pandas library. After loading the data, we will display the first 5rows to inspect the data.
The most important task in pre-processing such data is to check for NA/null values and eliminate them. Upon inspection of our data, we find that there are several NULL values in various columns, in order to deal with this, we replace the NULL values with the mean value of the data.
Upon viewing the information about the data types of our data, we find that there are several columns such as Age, Citology, Biopsy, etc whose data types are integers that need to be converted to float types.
Since the objective of our project is to detect cervical cancer, we create a column titled ‘result’ which contains binary values 0 and 1 as labels for ‘No Cancer’ and ‘Cancer’.
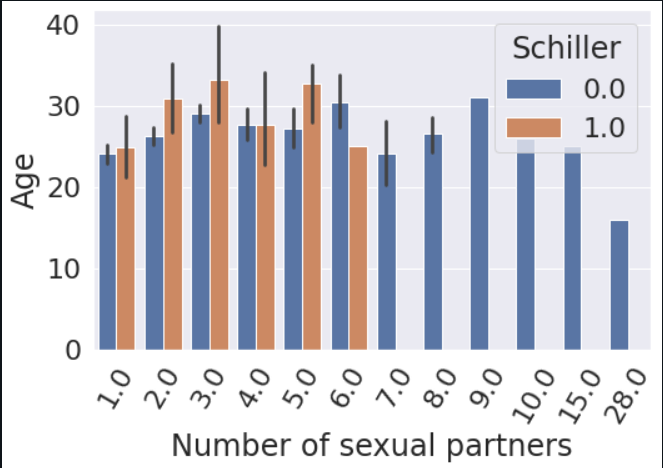
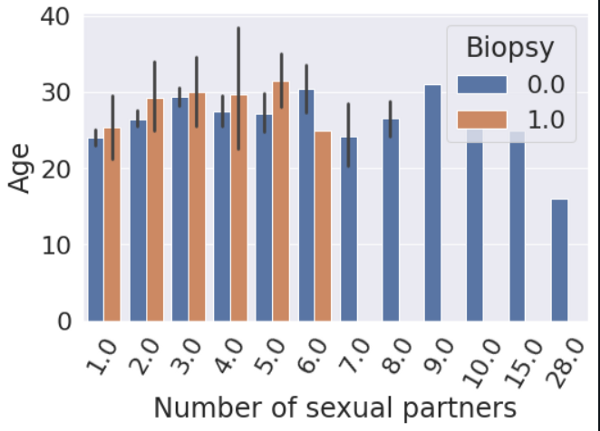
In this step, we will use several plotting techniques to check for correlation between various columns of the data. Let us visualize the relationship between Age, Number of Sexual Partners, and other columns such as Biopsy and Schiller as hue (colour) parameters.
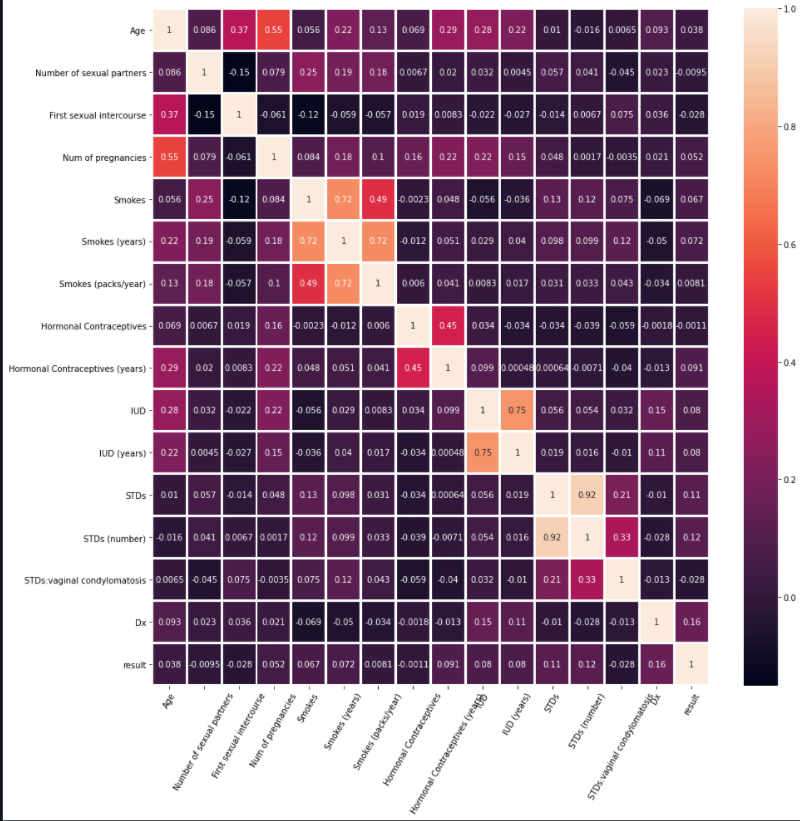
Next, we drop all the irrelevant columns and thereby, select only the columns that are beneficial for training the model and visualize the relationship between all the relevant columns with the help of a heatmap.
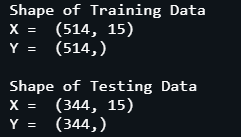
After visualizing the data, we can move forward to the next step of our classification task, and that is, pre-processing our data further to feed into the neural network model. We split the data into training and testing halves with a test size of 40%. We will use this test data to validate our model.
After splitting the data, we will use StandardScaler to scale our data. To learn more about this technique, follow this link.
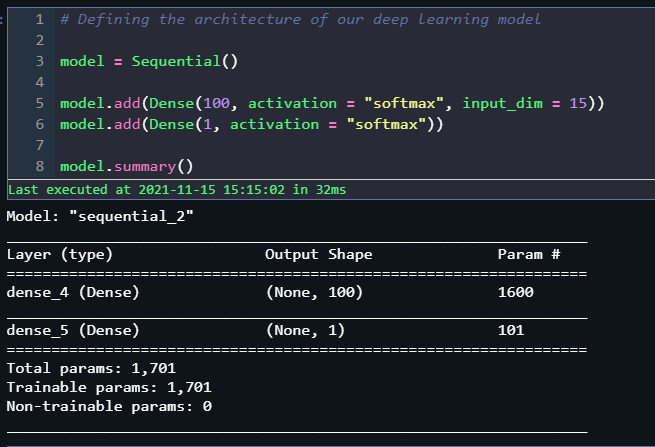
Now, we get to the exciting part. We will design the architecture of our neural network. Let us start with initializing our Sequential() model and add Dense() layers to it.
For input, we see that we have 15 columns of the data for training. Hence, we will set our input dimensions as 15. Since our target variables are 2, we will add a last Dense layer containing 2 dimensions.
We compile our model using Adam optimizer with a learning rate of 0.0000001 and set our loss function to ‘categorical crossentropy’.
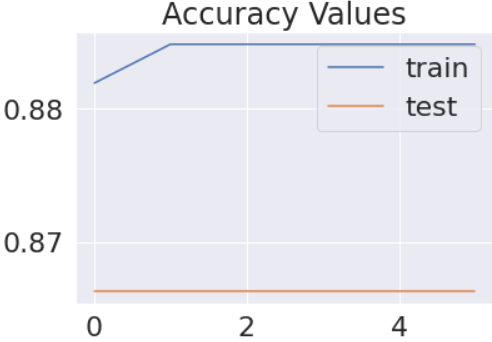
After compilation, we train our model using the training data and use the testing data for validation. Setting a batch size of 5 and training for 100 epochs, we achieve 88% accuracy for training data and a peak validation accuracy of about 86%.
We’ve also used an EarlyStopping checkpoint that stops training the model when the validation model accuracy does not improve for 5 epochs. On plotting the model performance with the number of epochs passed, we can visualize the training performance of our model.
The last step is to save our model and evaluate its performance further on the testing data by making predictions on it and evaluating using a classification report.
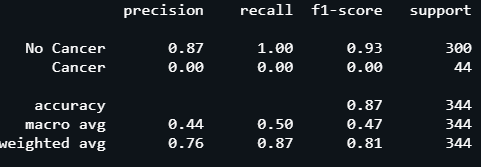
On checking the performance of our model, we observe that our model performs exceptionally well. It is safe to conclude that our model is a great success and performs really well on the data. Using machine learning techniques in order to contribute to the healthcare infrastructure of our society is an ideal use of this technology.
Thanks for reading this article! I hope you find the contents useful.
Best of luck with your Machine Learning career.
Notebook Link : Click Here
Credit : Kkharbanda