Detecting whether a person is confused or not based on the EEG recordings.
Photo by George Vald on Dribbble
Do students always ask doubts when they are confused? How do you know if someone is confused? Facial expressions, maybe. Confusions happen when we are not able to comprehend what we see/hear.
EEG, which stands for electroencephalography, is a method to record the electrical activity of the brain using electrophysiological monitoring.
This is done through non-invasive (in most cases) electrodes placed along the scalp that records the brain’s spontaneous electrical activity over a period of time.
Here, we track these EEG signals to detect whether a person is confused or not.
Implementation of the idea on cAInvas — here!
Wang, H., Li, Y., Hu, X., Yang, Y., Meng, Z., & Chang, K. M. (2013, June). Using EEG to Improve Massive Open Online Courses Feedback Interaction. In AIED Workshops. PDF
EEG signal data was collected from 10 college students while watching MOOC video clips of subjects ranging from simple ones like basic algebra or geometry to Stem Cell Research and Quantum Mechanics that can be confusing if we are not familiar with the topic.
There were 20 videos, 10 simple ones and 10 complex ones, each 2 minutes long. The clips were copped in the middle of a topic to make it more confusing.
The students wore a single-channel wireless MindSet that measured activity over the frontal lobe. The MindSet measures the voltage between an electrode resting on the forehead and two electrodes (one ground and one reference) each in contact with an ear.
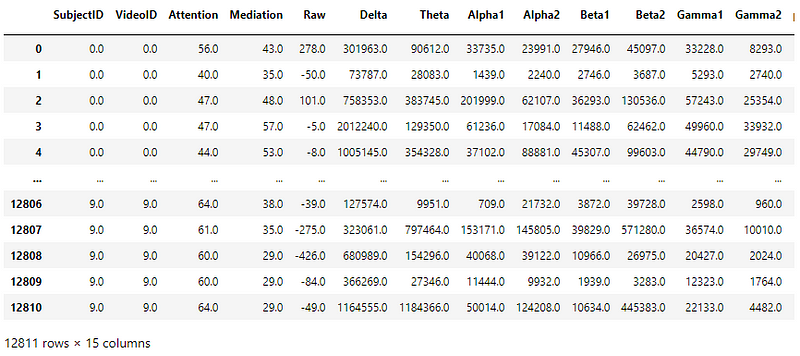
There are two label columns — user-defined label (self-labeled by the students based on their experience) and predefined label (where they are expected to be confused).
Snapshot of the dataset
Preprocessing
Time-based data frame
Since this is a time-based dataset, the features are appended to include values from previous timesteps of the same subject (student) watching the same video.
A time window of 5 is defined, i.e., attribute values from 5 timesteps are combined to create one row of the final dataset. If the subject x video data frame subset has fewer timestamps than the defined time window, they are discarded.
Dropping unwanted columns
SubjectID and VideoID should not influence the final results and hence are removed. User-defined labels are more reliable in assessing the level of confusion rather than predefined labels.
Train-validation-test split
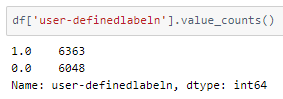
A peek into the spread of target values across the dataset —
Target values
This is an almost balanced dataset. Let’s go ahead with it.
Splitting it into train, validation, and test set using an 80–10–10 split ratio. They are then split into X (input) and y (target) of the respective categories for further processing.
Standardization
The standard deviation of attribute values in the dataset is not the same across all of them. This may result in certain attributes being weighted higher than others. The values across all attributes are scaled to have mean = 0 and standard deviation = 1 with respect to the particular columns.
The StandardScaler function of the sklearn.preprocessing module is used to implement this concept. The instance is first fit on the training data and used to transform the train, validation, and test data.
The model
The model is a simple one with 3 Dense layers, 2 of which have ReLU activation functions and the last one has a Sigmoid activation function that outputs a value in the range [0, 1]. This is interlaced with 1 Dropout layer with a keep probability of 0.2.
As it is a binary classification problem, the model is compiled using the binary cross-entropy loss function. The Adam optimizer is used and the accuracy of the model is tracked over epochs.
The EarlyStopping callback function of the keras.callbacks module monitors the validation loss and stops the training if it doesn’t decrease for 5 epochs continuously. The restore_best_weights parameter ensures that the model with the least validation loss is restored to the model variable.
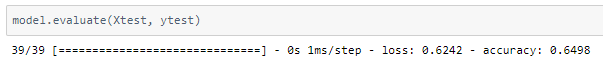
The model was trained with a learning rate of 0.01 and an accuracy of ~65% on the test set.
Model Training
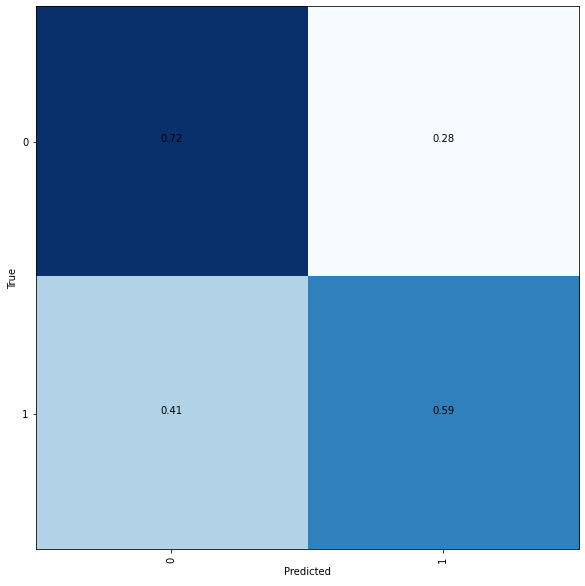
Plotting a confusion matrix to understand the results better.
Confusion matrix
The low accuracy rate may be increased with better-labeled data. Self-labeled data indicating mental state is easy to be mislabeled.
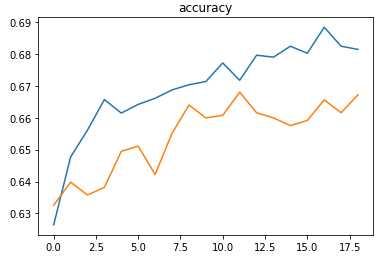
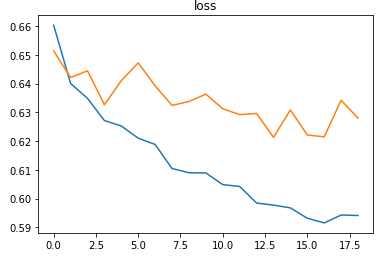
The metrics
A plot of the accuraciesA plot of the losses
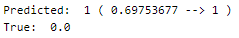
Prediction
Let’s perform predictions on random test data samples —
Prediction on a random sample
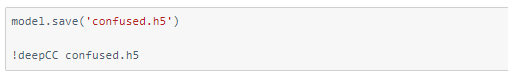
deepC
deepC library, compiler, and inference framework are designed to enable and perform deep learning neural networks by focussing on features of small form-factor devices like micro-controllers, eFPGAs, CPUs, and other embedded devices like raspberry-pi, odroid, Arduino, SparkFun Edge, RISC-V, mobile phones, x86 and arm laptops among others.
Compiling the model using deepC —Code: deepC compilation
Head over to the cAInvas platform (link to notebook given earlier) and check out the predictions by the .exe file!
Credits: Ayisha DAlso Read: Language identification of text — on cAInvas
Finding out about Deep Learning, the technology enabling machines to interpret complex data and mimic human cognition
Become a Contributor: Write for AITS Publication Today! We’ll be happy to publish your latest article on data science, artificial intelligence, machine learning, deep learning, and other technology topics