
The objective of this study is to classify medical images using the Convolutional Neural Network(CNN) Model.
Here, I trained a CNN model with a well-processed dataset of medical images. This model can be used to classify medical images based on categories provided as per the training dataset.
Implementation is here…
About the dataset
This dataset was developed in 2017 by Arturo Polanco Lozano. It is also known as the MedNIST dataset for radiology and medical imaging. For the preparation of this dataset, images have been gathered from several datasets, namely, TCIA, the RSNA Bone Age Challange, and the NIH Chest X-ray dataset.
This dataset contains 58954 medical images belonging to 6 categories — AbdomenCT(10000 images), HeadCT(10000 images), Hand(10000 images), CXR(10000 images), CXR(10000 images), BreastMRI(8954 images), ChestCT(10000 images).
Dataset size is 75.98 MB.
Data Preparation
In this dataset, we were provided six different directories each consisting of tens of thousands of images. However, in order to feed this data into a CNN model, we first need to extract it into training and test set from it.
Here we already created an empty directory first named, “test_dir” with all subfolders in it as they are in “train_dir” and “train_dir” consists of all folders of images.
After creating the test set, we can validate whether both the directories, namely “train_dir” and “test_dir” have the same number of classes.
Image Preprocessing
As per the technical definition of the term, Image processing is the technical analysis of an image by using complex algorithms. Here, we use the image as the input, and the output is returned as useful information about it.
The report “Image Recognition Market by Technology (Digital Image Processing, Facial Recognition, Pattern Recognition), Component (Hardware, Software, and Services), Deployment Mode (On-premises & Cloud), Application, Vertical, and Region — Global Forecast to 2025”, the global image recognition market size to grow from USD 26.2 billion in 2020 to USD 53.0 billion by 2025, at a Compound Annual Growth Rate (CAGR) of 15.1% from 2020 to 2025.
An increase in the need for efficient and profitable retail execution processes with adherence to compliance standards is one of the major factors expected to drive the growth of this market.
Now one can imagine the importance of the role image processing plays in building a good model.
Below I have discussed the parameters and functions that were defined during image preprocessing:
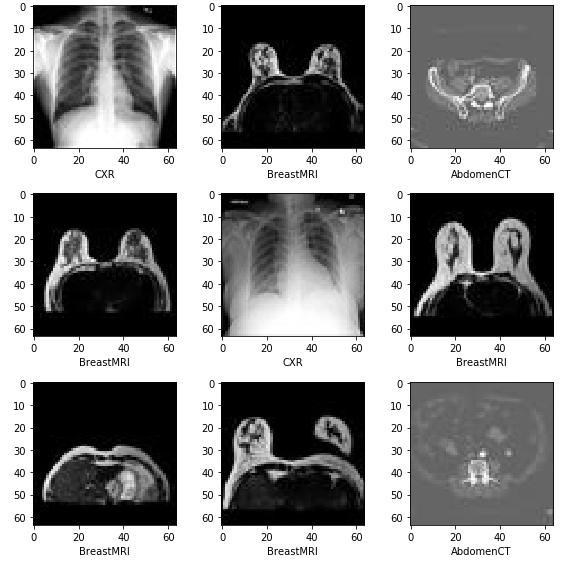
- Firstly, I created a function to display a sample image from a directory.
- image_size(height, width) as (32, 32). In this dataset, we had nearly 10,000 images for every class. Moreover, all images were types of medical images i.e, X-rays, CT Scans, or MRIs. And most parts of those types of images are blurry. Hence, a much bigger size will not add more value as compared with increased training time due to increased image size.
- batch_size(), it is a hyperparameter that simply defines the number of samples to work through before updating the internal model parameters.
- class_mode(), here I used class _mode as “categorical”. Since, it determines the type of label arrays that are returned, here in the case of “categorial”, it will be 2D one-hot encoded labels.
Defining the model
For this image classification model, we defined a convolutional neural network model with seven layers. Here, 2 layers have ReLU(Rectified Linear Unit) and the last one has a “Softmax” activation function.
Here we used “softmax”, the softmax function is used as the activation function in the output layer of neural network models that predict a multinomial probability distribution. That is, as in this case, we had multiple classes of images. Moreover, the softmax is very useful as it converts the scores to a normalized probability distribution, which can be later displayed to a user or can be used as input to other systems.
Further, the model was compiled using the categorical cross-entropy loss function.
“Adam” is used as an optimizer, because of its ability to adjust the learning rate of the model on its own as per the situation.
Callbacks
Here we used multiple callbacks, a callback is simply an object that can perform actions at various stages of training(e.g. at the start or end of an epoch, before or after a single batch, etc).
- Early Stopping: Used to stop training when a monitored metric has stopped improving.
- Reduce LR On Plateau: Used to reduce learning rate when a metric has stopped improving.
- Model Checkpoint: Used to save the Keras model or model weights at some frequency.
Model Summary

Inference
The model achieved an exceptional accuracy of 99% on the validation set and 99% of accuracy on the test set.
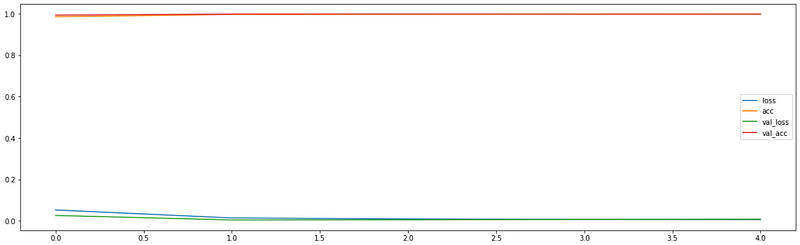
Plotting Graphs
The graph between loss, accuracy, validation loss, and validation accuracy.
- “loss” represented training loss
- “acc” represented training accuracy
- “val_loss” represented validation accuracy
- “val_acc” represented validation accuracy
Notebook Link: Here
Credit: Akash Rawat
Also Read: Classifying Flower through Sequential-API-Deep Learning