A scientific approach for determining red wine quality using Deep Learning!

Red wine’s been a part of our society since millenniums through social gatherings, religious events or even through cultural engagements. There is no denying that drinking red wine is beneficial for our health. It is highly beneficial in preventing or curing several cardiovascular diseases, hypertension, metabolic syndrome, neurological disorders and many more diseases.
Drinking red wine is good for our body as long as it is in the ideal amount. Consuming more than 1–2 glasses of red wine per day is harmful for our body as it increases alcohol consumption.
It is also recommended to have 1–2 alcohol free days in a week!
Let us use our Machine Learning knowledge to determine the quality of red wine based on several factors such as:-
1. Fixed Acidity Level
2. Volatile Acidity
3. Citric Acid
4. Residual Sugar
5. Chlorides
6. Free Sulfur Dioxide
7. Density
8. pH level
9. Sulphates
10. Alcohol content
The data necessary for our task can be accessed through this link.
Right, now that we have the data, we need a platform where we can perform our data visualization, pre-processing and training of our neural network classifier. In order to do so, we can use the AITS Cainvas Platform. This gives us access to highly efficient GPUs and we can prepare our jupyter notebooks easily.
Let us begin by importing the data in form of a CSV file with the help of pandas library.Pandas is a library which provides easy-to-use data structures for storing information, performing visualization tasks and pre-process the data with the help of other libraries.
When we look at the data first, we first check for NULL values. We find that there is no NULL value in the data so we don’t have to deal with them.
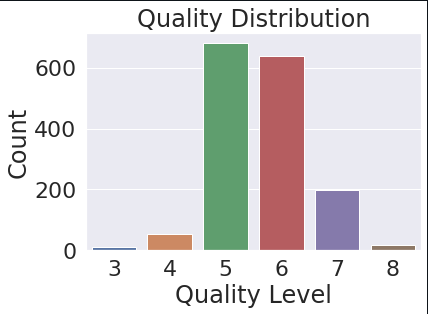
The next step is to determine the quality distribution level. We find that the quality levels in the data are 3 , 4 , 5 , 6, 7 , 8. Using the seaborn library, we count the occurrence of each quality level. We observe that the data is unevenly distributed around quality level 5 and 6 with other levels being under-represented.
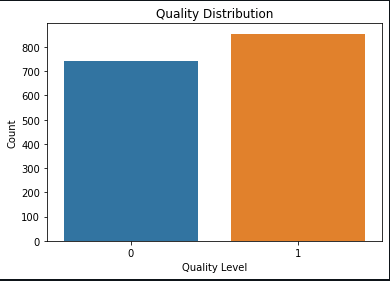
If we train our model around this data, the model would be biased towards quality level 5 and 6 since these classes are highly represented. In order to deal with problem, we pre-process the data and distribute the quality levels into two classes as follows:
1. Class 0: Quality Levels {3, 4, 5}
2. Class 1: Quality Levels {6, 7, 8}
By making it a two class problem, we plot the occurrence of these classes and conclude that the data is evenly distributed. Even the most sophisticated ML algorithms and Neural Networks need a fair data to ensure high testing accuracy and reduce the losses.
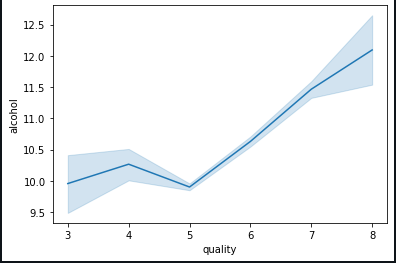
Let us understand the effect of various other features on wine quality by data visualization. On plotting a line graph between alcohol concentration, we conclude the quality of wine increases when alcohol concentration is between 10.5% — 12%.
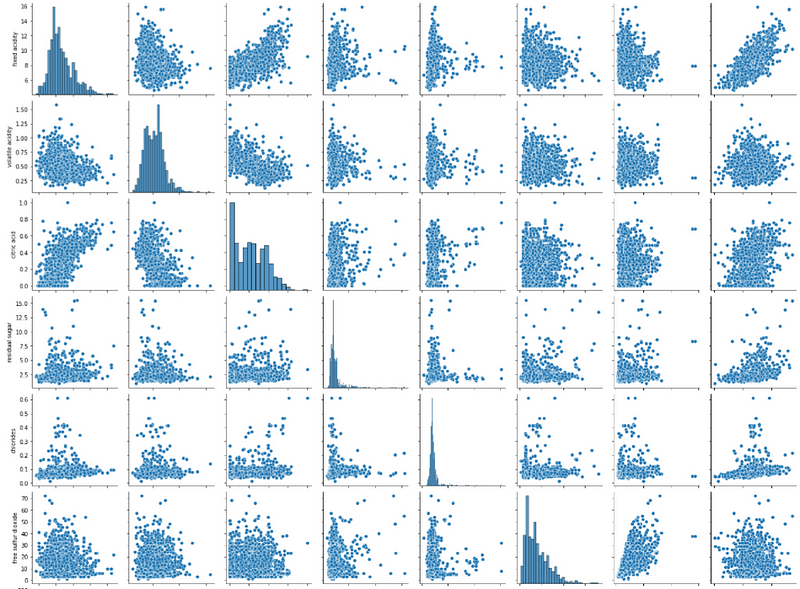
In order to visualize our entire data and understand relations and effects at one go, we can use a pairplot which plots the entire numeric data across the X-axis and the Y-axis across a single row and column respectively. Follow this link to learn more about pairplots.
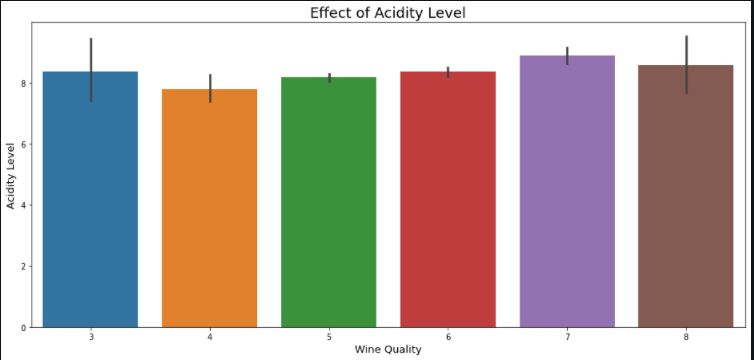
Next, we understand the effect of acidity levels on wine quality with the help of a bar chart.
After we’re done with visualizing our data, the next step is to split the data into training and testing parts using the train_test_split() method from scikit-learn library. We make a training and testing split in a ratio of 3:1.
Another important step at this stage is to pre-process the data. We achieve this with the help of MinMaxScaler(). This scaling function transforms all the features in such a way that they lie between 0 and 1. This way, we ensure that the entire data is uniformly distributed along a common scale.
A good practice while preparing deep learning models is to use the callbacks feature of Keras. By using EarlyStopping() and monitoring validation loss, our model stops training if the validation loss does not reduce for 5 epochs. This way, we ensure a minimum loss value and also prevent overfitting upto some extent.
Defining the architecture of our Sequential model is the next step. Since we have 11 features, we set the input dimensions to 11 and set up several Dense layers followed by Dropout layers and again some Dense layers.
The main function of adding Dropout layers is to prevent overfitting. It randomly drops or ignores several layer outputs and reduces them to 0. It encourages the neural network to learn a sparse network. Finally, we print our model summary and observe that there are about 240k trainable parameters in our model.
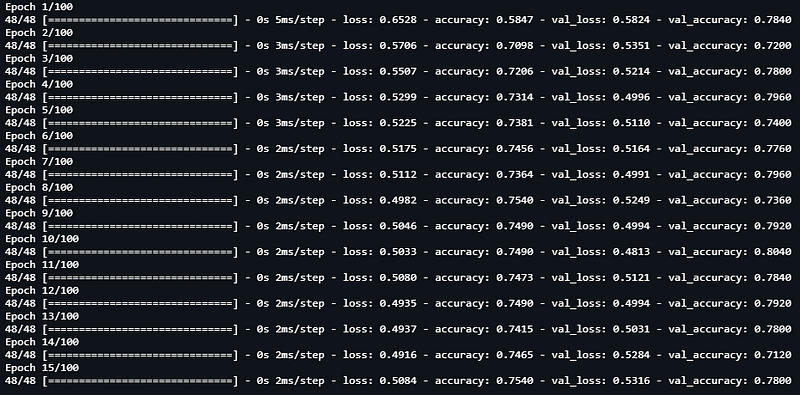
Compiling our model using the Adam optimizer having a learning rate of 0.001 and categorical crossentropy as our loss function, we begin training by setting a batch size of 25 and initialize training for 100 epochs.
After our training terminates, we observe that the we have achieved a validation accuracy of 80% and loss value as low as 0.5.
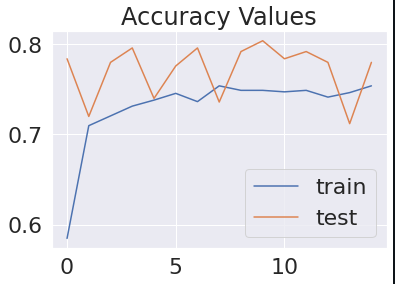
By plotting the accuracy and loss of our model, we notice that our training terminated before it could complete a cycle of 100 epochs, hereby reducing accuracy and ensuring minimum loss value.
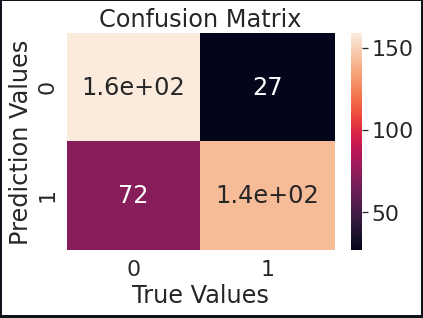
Finally, to check the performance of our model, we plot a Confusion Matrix on the testing data and verify that indeed our model is accurate.
Our model is a success based on the data. We have finally completed this project and can conclude the advantages of Machine Learning and Deep Learning industry are immeasurable.
Using such DNN models, wine quality enhancement can be ensured by monitoring and managing production in the vineyard as well as the cellar to improve the efficiency of processes and create ideal conditions for grapes to grow and wine to age.
If you’d like to learn more and access the full notebook, follow this link.
Best of luck for your machine learning careers.
Cheers!
Notebook Link: Here
Credit: Kkharbanda
Also Read: Tyre Pressure Detection using CNN