Predict a customer’s behaviour in online shopping websites for KPI and marketing analysis.

How do we know if a customer is going to shop or walk away? Understanding the customers is crucial to any seller/store/online platform. This understanding can be important in convincing a customer who is just browsing to buy a product.
In offline stores, the inferences derived influence the placement of objects in the store. When the same experience is translated to an online store, the sequence of web pages browsed to reach a product becomes important.
Here, we analyze the behaviour of customers as they browse through the pages to predict if they will make a purchase or not.
Implementation of the idea on cAInvas — here!
The dataset
C. Okan Sakar Department of Computer Engineering, Faculty of Engineering and Natural Sciences, Bahcesehir University, 34349 Besiktas, Istanbul, Turkey
Yomi Kastro Inveon Information Technologies Consultancy and Trade, 34335 Istanbul, Turkey
Sakar, C.O., Polat, S.O., Katircioglu, M. et al. Neural Comput & Applic (2018).
The dataset is a CSV file with 18 attributes (10 numerical and 8 categorical) and 1 target column.
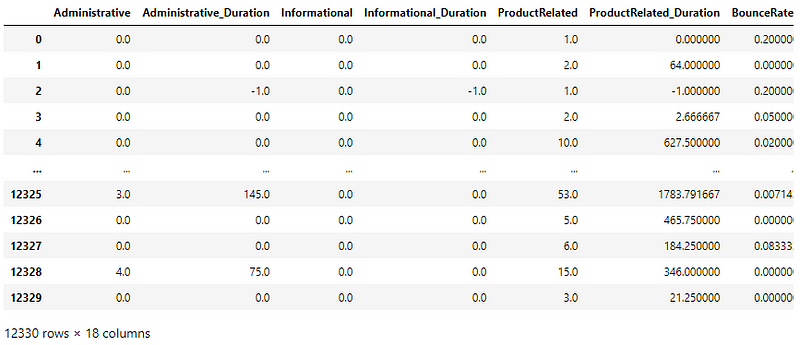
A look into the columns in the dataset —
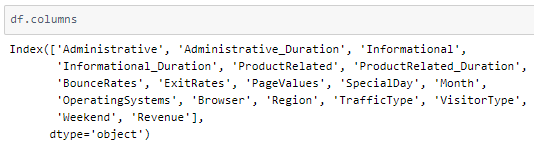
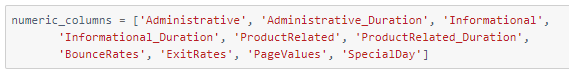
Administrative, Administrative Duration, Informational, Informational Duration, Product Related, and Product Related Duration represent the number of times visited and the duration of time spent in the respective categories of websites.
The Bounce Rate (the percentage of visitors who enter and leave the site without triggering any request), Exit Rate (percentage of sessions that ended int the page relative to all page views), and Page Value (the average value for a web page that a user visited before completing an e-commerce transaction) features represent the metrics measured by “Google Analytics” for each page in the e-commerce site.
The Special Day feature indicates the closeness of the site visiting time to a specific special day.
Other attributes such as operating system, browser, region, traffic type, visitor type, weekend, and month give us more information on the users.
Revenue is the target column that indicates if the user made a purchase (thus generating revenue).
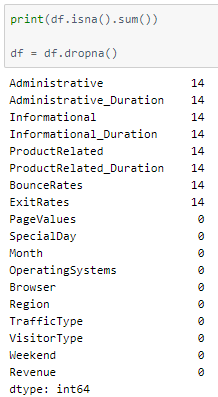
There are some NaN values in the dataset. Let us drop them for now —
A peek into the class label distribution —
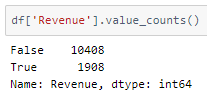
It’s not balanced but let us see how our model performs on this data.
Preprocessing the input and output attributes
Numeric columns will be standardized later.
A peek into the values in the ‘Month’ column
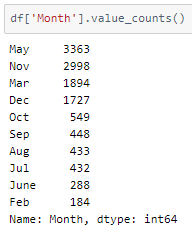
Only 10 out of 12 months are in the data frame. The month column needs to be one-hot encoded with all the 12 months in the count.
In addition to that, the Weekend and Revenue columns having data type boolean are converted to an integer.
The columns Operating Systems, Browser, Region, TrafficType, and VisitorType have values that do not have any range dependency. They are one hot encoded using the get_dummies() function of the pandas library.
The drop_first parameter is set to True. This means that if there are n categories in the column, n-1 columns are returned instead of n. i.e., each value is returned as an n-1 value array. The first category is defined by an array with all 0s while the remaining n-1 category variables are arrays with 1 in the (i-1)th index of the array.
Train-validation-test split
Defining the input and output columns for use later —
There are 70 input columns and 1 output column.
Using an 80–10–10 ratio to split the data frame into train-validation-test sets. The train_test_split function of the sklearn.model_selection module is used for this.
Standardization
The standard deviation of attribute values in the dataset is not the same across all of them. This may result in certain attributes being weighted higher than others. The values across all attributes are scaled to have mean = 0 and standard deviation = 1 with respect to the particular columns.
Defining the numeric columns to be standardized —
The StandardScaler function of the sklearn.preprocessing module is used to implement this concept. The instance is first fit on the training data and used to transform the train, validation, and test data.
These are then divided into X and y (input and output) for further processing.
The model
The model is a simple one with 3 Dense layers, 2 of which have ReLU activation functions and the last one has a softmax activation function that outputs a single value in the range [0,1].
As it is a classification problem with only two categories, the model is compiled using the binary cross-entropy loss function. The Adam optimizer is used and the accuracy of the model is tracked over epochs.
The EarlyStopping callback function of the keras.callbacks module monitors the validation loss and stops the training if it doesn’t decrease for 5 epochs continuously. The restore_best_weights parameter ensures that the model with the least validation loss is restored to the model variable.
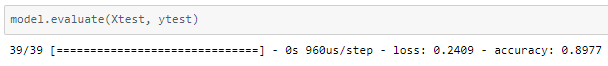
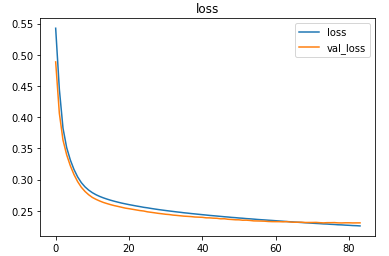
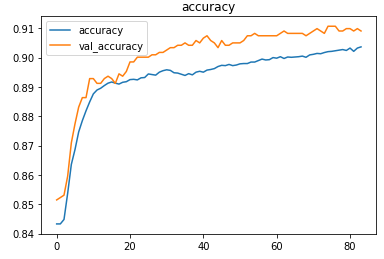
The model was trained with a learning rate of 0.0001 and an accuracy of ~90% was achieved on the test set.
Plotting a confusion matrix to understand the results better —
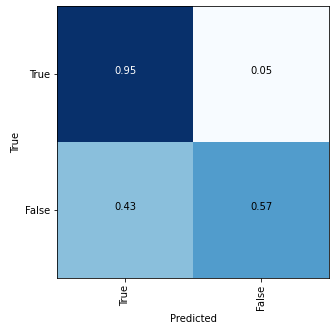
A better distribution of class labels can give better accuracy.
The metrics
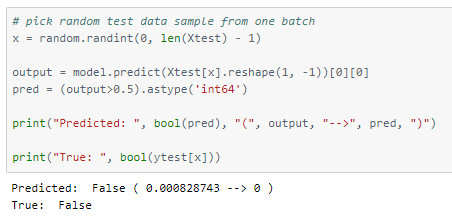
Prediction
Let’s perform predictions on random test data samples —
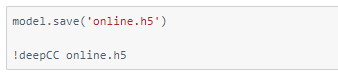
deepC
deepC library, compiler, and inference framework are designed to enable and perform deep learning neural networks by focussing on features of small form-factor devices like micro-controllers, eFPGAs, CPUs, and other embedded devices like raspberry-pi, odroid, Arduino, SparkFun Edge, RISC-V, mobile phones, x86 and arm laptops among others.
Compiling the model using deepC —
Head over to the cAInvas platform (link to notebook given earlier) and check out the predictions by the .exe file!
Credits: Ayisha D
Also Read: COVID-19: Face Mask Detector