
According to Wikipedia —
Parkinson’s disease (PD), or simply Parkinson’s, is a long-term degenerative disorder of the central nervous system that mainly affects the motor system. The symptoms usually emerge slowly, and as the disease worsens, non-motor symptoms become more common. The most obvious early symptoms are tremor, rigidity, slowness of movement, and difficulty with walking.
Parkinson’s Disease can cause slow motor movements, depression, anxiety, sleep and sensory system disorders, behaviour changes etc. Environmental factors and Genetic Inheritance are amongst the major contributing factors for Parkinson’s disease.
Spiral drawing is a skilled and complex coordinated motor activity. Therefore, it is treated as a sensitive motor assessment and a preliminary test for early symptoms of Parkinson’s disease.
This article presents a solution for detecting Parkinson’s disease using Spiral Drawings and Convolutional Neural Networks (CNN). The Cainvas Platform is used for implementation, which provides seamless execution of python notebooks for building AI systems that can eventually be deployed on edge (i.e. an embedded system such as compact MCUs).
The notebook can be found here.
The flow of the article is as follows —
- Description of the Problem Statement
- The Dataset
- Data Augmentation
- CNN Model Architecture
- Training the Model
- Performance of Model
- Testing models on Images
- Conclusion
Description of the Problem Statement
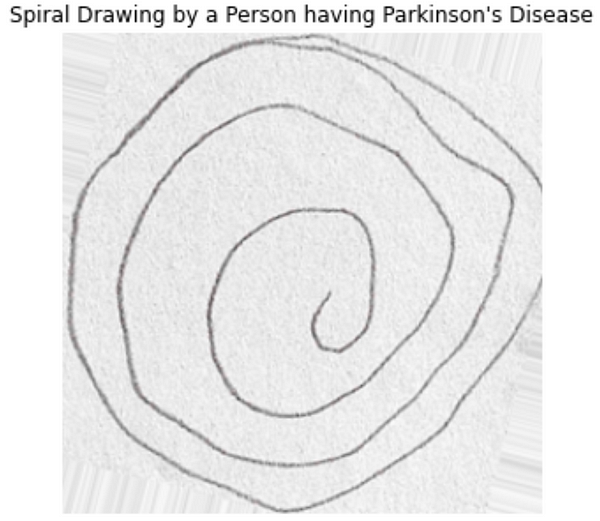
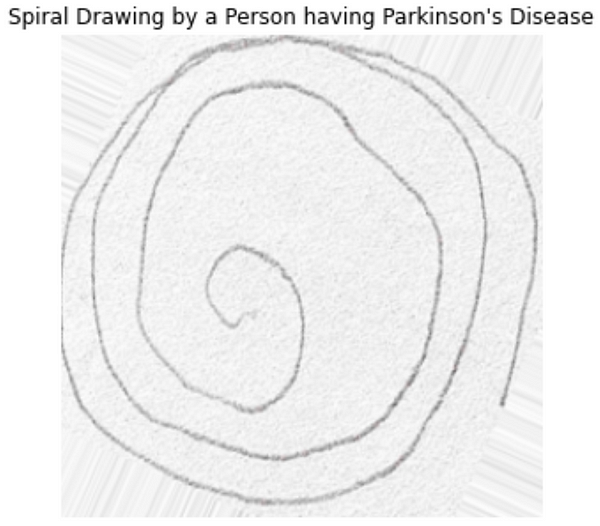
The project aims at presenting a solution for Parkinson’s disease detection using Spiral Drawings and CNN. The main idea behind the implementation is to classify a person as Healthy or having Parkinson’s disease by looking at the Spiral Drawing made by the person.
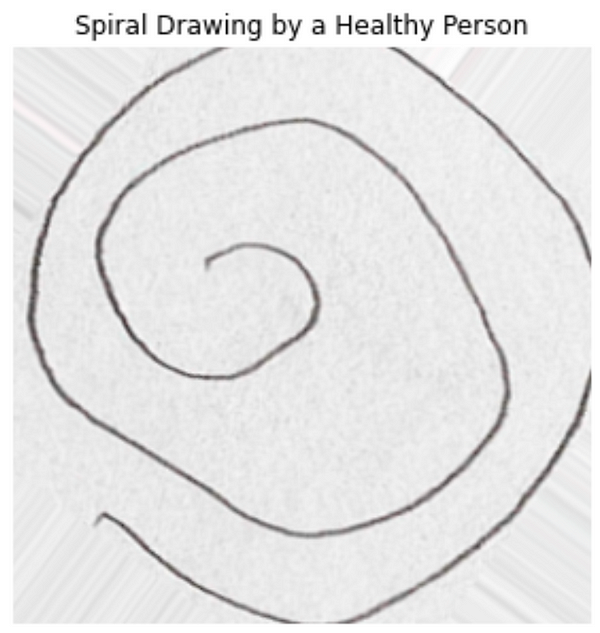
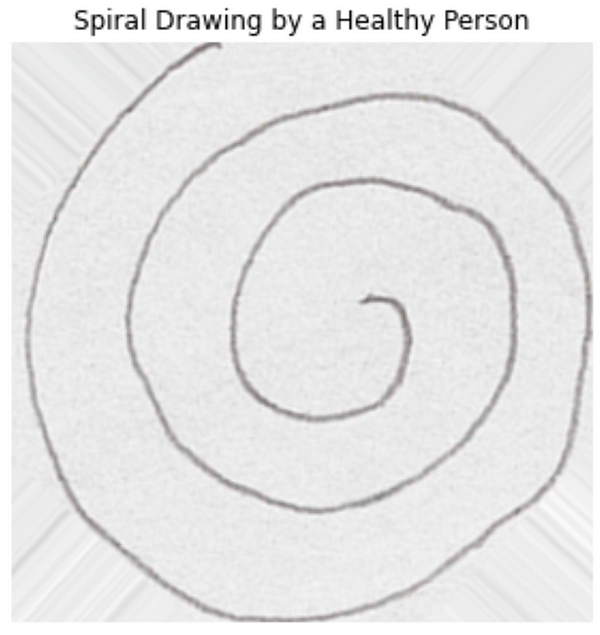
The Spiral Drawing created by a healthy person will look almost similar to a standard spiral shape. However, a spiral drawn by a person with Parkinson’s disease will highly deviate from a perfect spiral shape and look distorted due to slow motor movements and decreased coordination between hand and brain.
The Dataset
The dataset used here is the Parkinson’s Drawing Dataset present on Kaggle. The dataset can be accessed through this link. The dataset contains Spiral and Waves drawings made by healthy people and Parkinson’s disease infected people.
In this article, only Spiral Drawings are used for classification. The dataset already contains the Train Set and the Test Set, so no need to manually split the dataset.
The data distribution of the Train set and the Test Set can be visualised using the following plots —
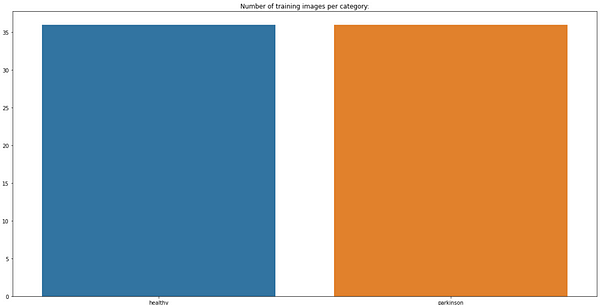
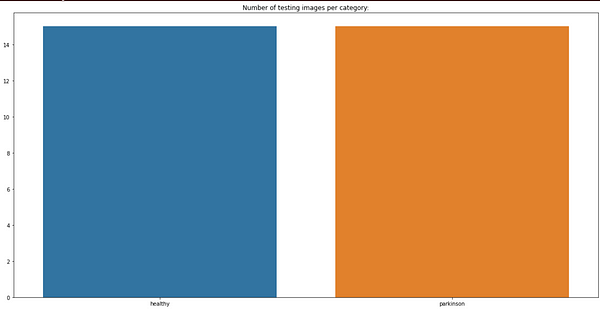
As can be seen, the dataset is already balanced. However, the dataset contains significantly fewer images per category in both train and test sets. So, the following section presents the augmentation of the dataset for artificially creating images for training and testing.
Visualising the images present in the dataset —
Data Augmentation
The following code is the implementation of the data augmentation process used to create images and increase the size of the dataset artificially —
Here, ImageDataGenerator is used to produce new images. The rotation range is set to 360 as the images are spiral and can be rotated any number of degrees without changing the image’s meaning. You can try other image transformations available under ImageDataGenerator class.
But be careful while applying any augmentation as certain transformations may lower the CNN model’s lower accuracy.
The data distribution after augmentation —
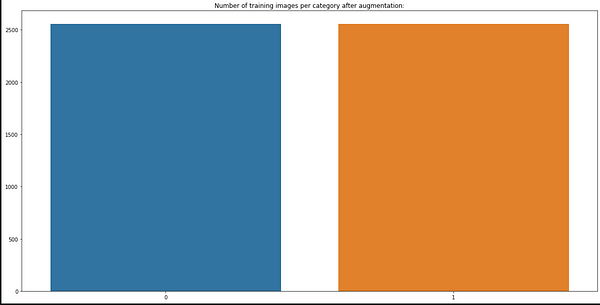

The images are also reshaped to a common size (128, 128, 1). Images are further normalised before fitting the dataset to the model.
CNN Model Architecture
The implementation uses a CNN model architecture with the following characteristics —
- The model contains four Convolutional Layers with 128, 64, 32, and 32 filters, respectively.
- The convolutional layers contain filters with varying filter sizes.
- A MaxPool2D layer follows each convolutional layer.
- Two Fully Connected layers follow the convolutional block.
Defining the model using Keras —
The model summary is as follows —
Model: "sequential_1"
_________________________________________________________________
Layer (type)                 Output Shape              Param #
=================================================================
conv1 (Conv2D)               (None, 128, 128, 128)     3328
_________________________________________________________________
max_pooling2d_4 (MaxPooling2 (None, 40, 40, 128)       0
_________________________________________________________________
conv2 (Conv2D)               (None, 40, 40, 64)        204864
_________________________________________________________________
max_pooling2d_5 (MaxPooling2 (None, 12, 12, 64)        0
_________________________________________________________________
conv3 (Conv2D)               (None, 12, 12, 32)        18464
_________________________________________________________________
max_pooling2d_6 (MaxPooling2 (None, 4, 4, 32)          0
_________________________________________________________________
conv4 (Conv2D)               (None, 4, 4, 32)          9248
_________________________________________________________________
max_pooling2d_7 (MaxPooling2 (None, 1, 1, 32)          0
_________________________________________________________________
flatten_1 (Flatten)          (None, 32)                0
_________________________________________________________________
dropout_2 (Dropout)          (None, 32)                0
_________________________________________________________________
fc1 (Dense)                  (None, 64)                2112
_________________________________________________________________
dropout_3 (Dropout)          (None, 64)                0
_________________________________________________________________
fc3 (Dense)                  (None, 2)                 130
=================================================================
Total params: 238,146
Trainable params: 238,146
Non-trainable params: 0
_________________________________________________________________
Training the Model
The model is trained with a learning rate of 3.15e-5 using Adam optimiser. The epochs and batch size are set to 70 and 128, respectively.
Performance of the Model
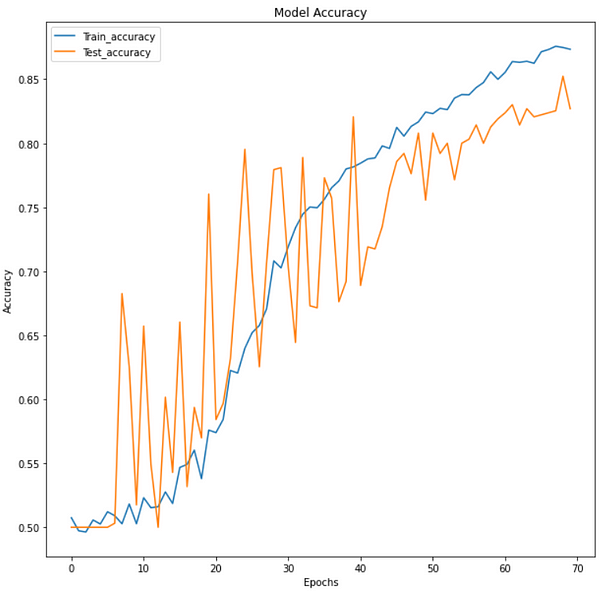
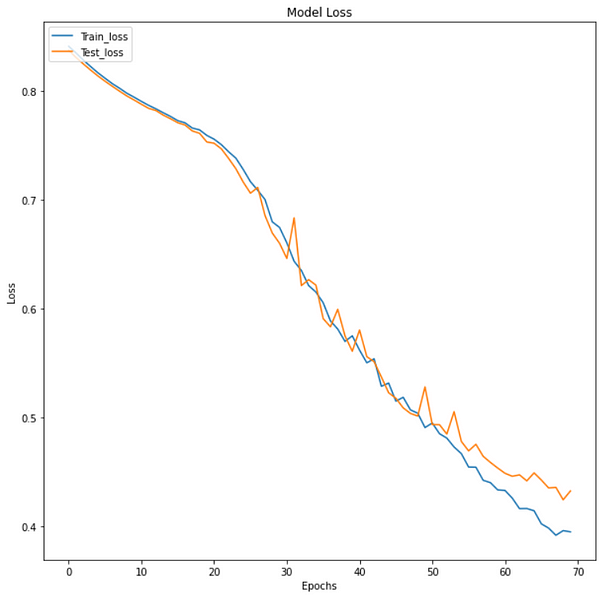
The Loss and Accuracy Plots, Classification Report and Confusion Matrix, are used as performance metrics for the model.
The Loss and Accuracy Plots are as follows —
Classification Report —
precision recall f1-score support
           0       0.88      0.75      0.81       315
           1       0.78      0.90      0.84       315
accuracy 0.83 630 macro avg 0.83 0.83 0.83 630 weighted avg 0.83 0.83 0.83 630
Confusion Matrix —
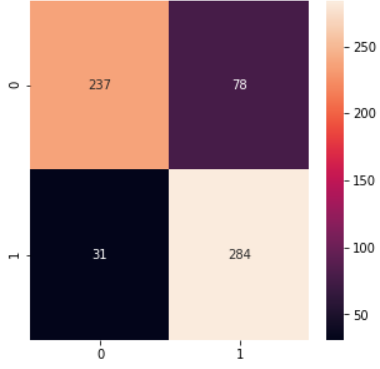
Here ‘Healthy’ is encoded to class 0, and ‘Parkinson’ is encoded to class 1.
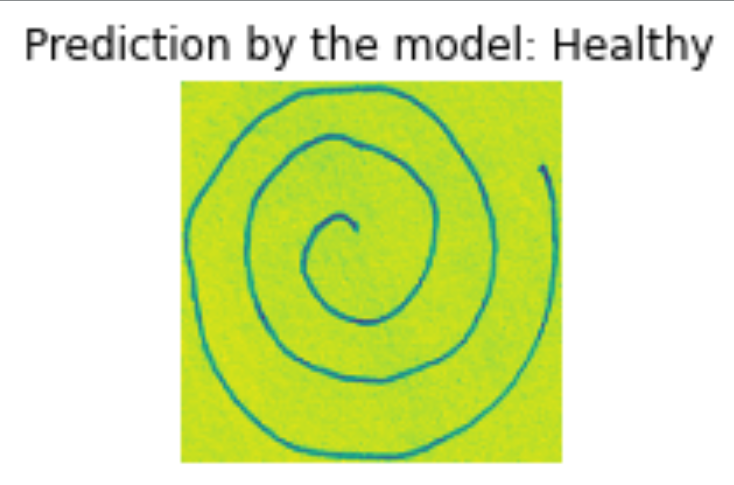
Testing model on Images
The code for testing the model on two images is presented below —
The results can be visualised as follows —
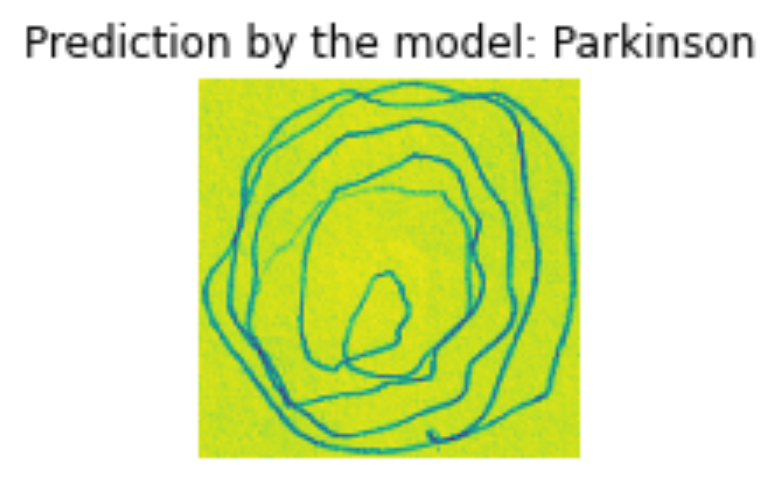
Similarly, testing for another image —
Conclusion
The article provides a brief overview of Parkinson’s disease and its causes, along with the use of Spiral Drawing as a preliminary test for Parkinson’s disease detection. The project aims at optimizing the model to limit the number of parameters under 250k for easy deployment on edge devices.
The implementation provides a solution for Parkinson’s disease detection using CNN to be deployed to an edge device or less computation efficient devices. This deployment is possible through the Cainvas Platform by making use of their compiler called deepC. Thus effectively bringing AI out on edge — in actual and physical real-world use cases.
Notebook Link: Here