Finding the category of the question asked, i.e., the type of answer to be given.

To answer a question, we need to understand the question and also the type of answer required. Different questions require different formats of answers. Categorizing questions based on answer formats helps in addressing the questions better.
For example, a question that starts with ‘how’ requires an answer that describes an event, a process, or procedure. This is called a descriptive answer. Questions with ‘what’ requires an answer that contains entities that fit the characteristics/definition given in the question.
For a conversational AI model, identifying the answer type is as important to answering the question as is understanding the context of the question.
Here, we categorize the questions into 6 categories — description, entity, abbreviation, numeric, human, and location.
Implementation of the idea on cAInvas — here!
The dataset
The dataset is a CSV file with questions and their corresponding categories and sub-categories. Subcategories give more insight into the type of question asked, like what entity? description of what? etc.
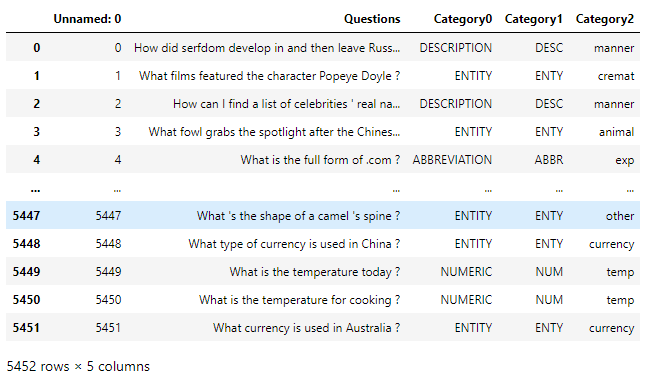
The dataset has 5 columns. ‘Unnamed: 0’ is a duplicate of the row indices and is not necessary. Category0 indicates the question category and Category1 contains the keys of the categories in the previous column. Category2 defines sub-categories.
For now, we will deal with categories only, and so, ‘Unnamed: 0’, Category1, and Category2 columns are dropped.
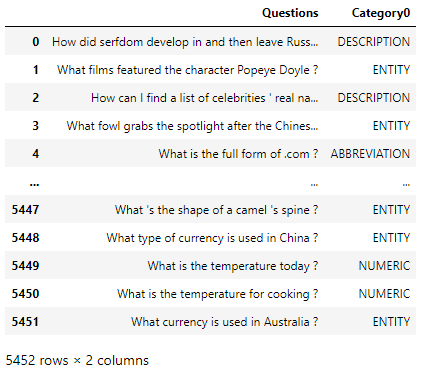
Looking at the dataset now —
Let’s look into the distribution of categories across the samples —
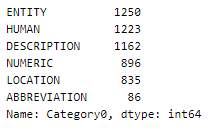
This is not a balanced dataset, There is a big difference in count between the entity and abbreviation categories. But we will go ahead with this.
These categories are not range dependent. Thus they are one-hot encoded for classification purposes. This is done using the get_dummies() function of the Pandas module. The returned columns are stored as y (target for the model).
Cleaning the text
To clean the text, we define the following functions, one to remove URLs, one to remove HTML tags, and one to keep only alphabets —
As words like what, who, whom, why, how, etc. are a part of the nltk stopwords package, they will not be removed in while cleaning the text.
Snowball stemmer of the nltk.stem module is used to get the root of the words in the message.
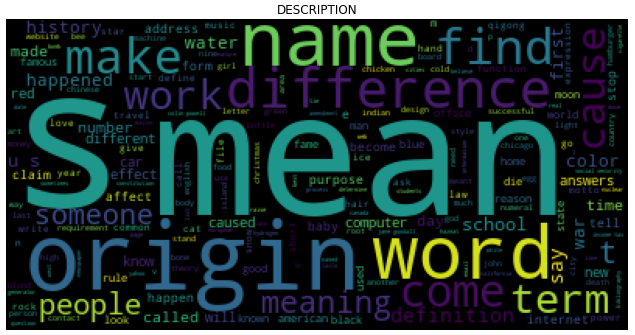
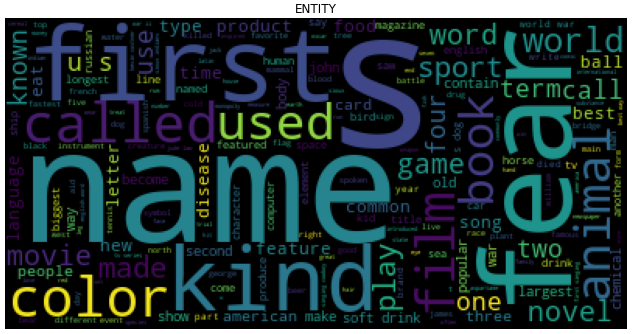
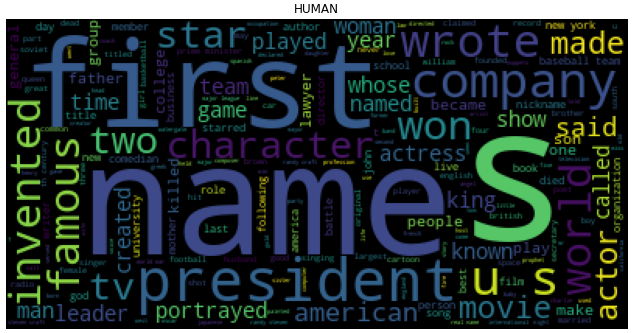
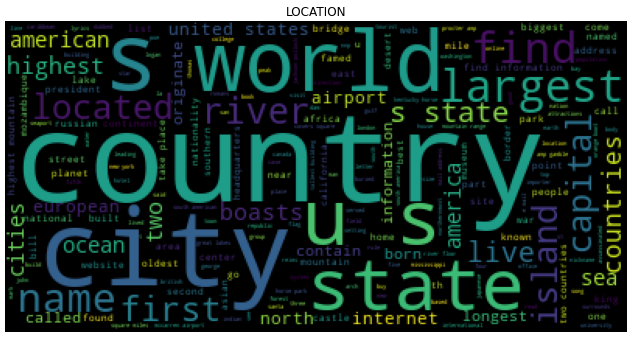
The words in all the categories are stored separately for visualization later.
The returned clean sentences are stored as X (input to the model).
Train-validation split
Splitting the dataset into train and validation set using 80–20 ratio.
The train set has 4361 samples and the validation set has 1091 samples.
Tokenization
The Tokenizer function of the keras.preprocessing.text module is used to convert the text into a sequence of integers to give as input to the model.
Xtrain and Xval are sparse matrices with numerical representations for each sample in the data frame.
Visualization
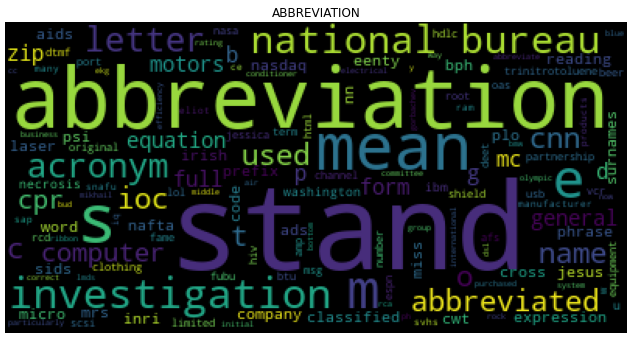
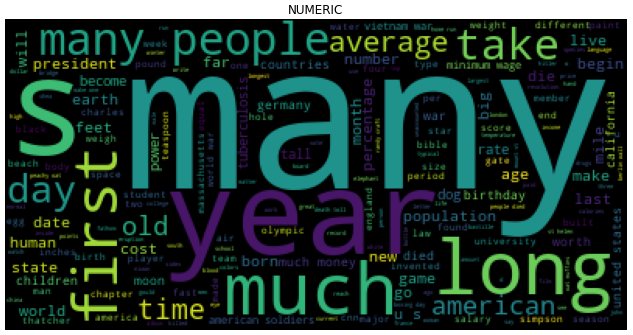
Using WordCloud to visualize the words and their frequency in each subject. The size of the word is directly proportional to the font size.
The model
The model consists of an embedding layer that converts the input samples (sparse) into dense arrays of fixed size. This is followed by an LSTM and two Dense layers.
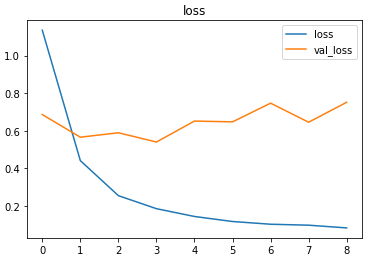
The model is compiled using the CategoricalCrossentropy loss as the targets are one hot encoded arrays. Adam optimizer is used and the model’s accuracy is tracked.
The EarlyStopping callback function of the keras.callbacks module tracks a metric (here, val_loss by default) for the given number of epochs and stops training if the metric doesn’t improve (decrease if loss, increase if accuracy).
The restore_best_weights parameter ensures that the model with the least validation loss (or best value of metric) yet is restored to the model variable.
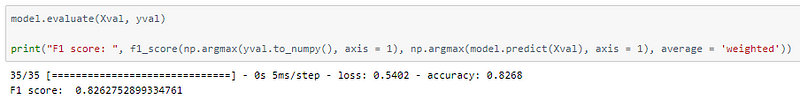
The model achieved ~82.6% accuracy and F1 score of ~0.826 on the test set after training with a learning rate of 0.01.
Peeking into the confusion matrix to understand the results better —
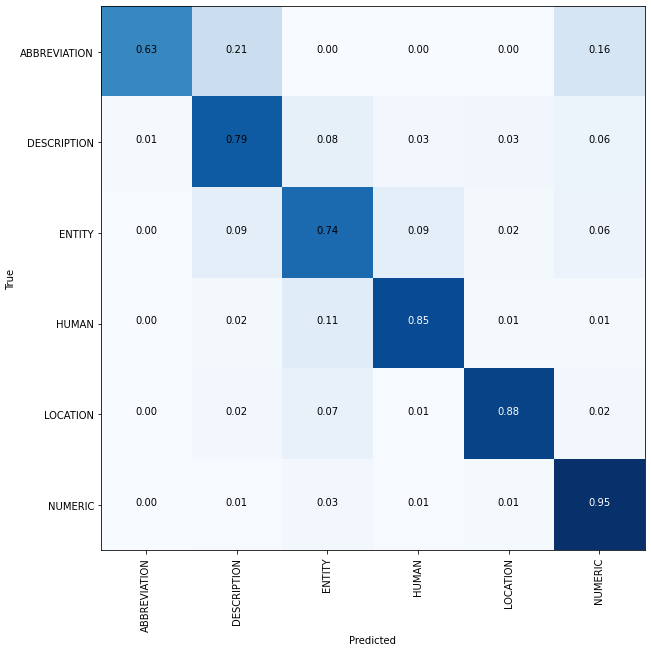
A higher number of samples in the abbreviation category will help in achieving better accuracy.
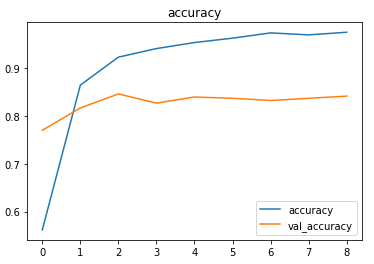
The metrics
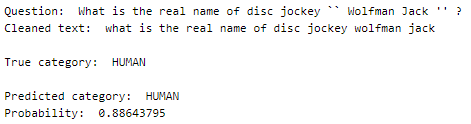
Prediction
Let us perform predictions on random test samples —
The text sample is taken from the original CSV file, cleaned, tokenized, and then input to the model as an external sample would have to go through the same process.
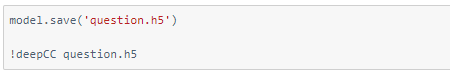
deepC
deepC library, compiler, and inference framework are designed to enable and perform deep learning neural networks by focussing on features of small form-factor devices like micro-controllers, eFPGAs, CPUs, and other embedded devices like raspberry-pi, odroid, Arduino, SparkFun Edge, RISC-V, mobile phones, x86 and arm laptops among others.
Compiling the model using deepC —
Head over to the cAInvas platform (link to notebook given earlier) to run and generate your own .exe file!
Credits: Ayisha D
Also Read: Detecting fires in road surveillance — on cAInvas