Detecting Parkinson’s disease in patients using speech signals.

Parkinson’s disease is a long-term degenerative disorder of the central nervous system. It leads to shaking, stiffness, difficulty with walking, balance, and coordination. The symptoms arise slowly and worsen over time.
IoT is an effective solution in cases where continuous monitoring of patients is required.
And as always, deep learning has proved effective in analyzing and drawing inferences from medical data.
In this article, we will train a neural network to analyze voice data from patients with and without Parkinson’s and classify them accordingly.
A link to the implementation on cAInvas — here.
The dataset
Source:
Max A. Little, Patrick E. McSharry, Eric J. Hunter, Lorraine O. Ramig (2008), ‘Suitability of dysphonia measurements for telemonitoring of Parkinson’s disease’, IEEE Transactions on Biomedical Engineering
The dataset was created by Max Little of the University of Oxford, in collaboration with the National Centre for Voice and Speech, Denver, Colorado, who recorded the speech signals. The original study published the feature extraction methods for general voice disorders.
Dataset information
This dataset is composed of a range of biomedical voice measurements from 31 people, 23 with Parkinson’s disease (PD). Each column in the table is a particular voice measure, and each row corresponds to one of 195 voice recordings from these individuals.
The main aim of the data is to discriminate healthy people from those with PD, according to the “status” column which is set to 0 for healthy and 1 for PD.
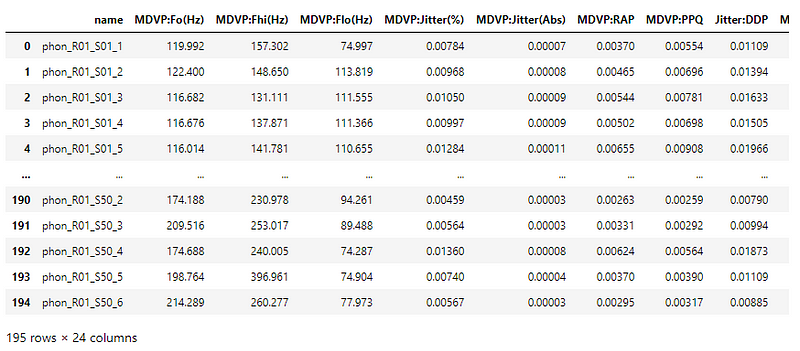
The dataset has to be shuffled since the status column is ordered.
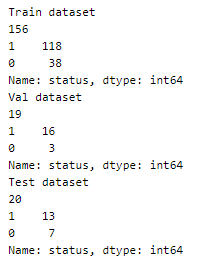
Let’s look at the spread of values among the different classes.

It is an unbalanced dataset.
Preprocessing
Defining the input and output columns
The model in this article uses the categorical cross-entropy loss function and thus there are two output columns — yes and no.
https://gist.github.com/426d9b5ab155b96202d4521147436502
MinMaxScaler
Let us look at the range of values of the different attributes.
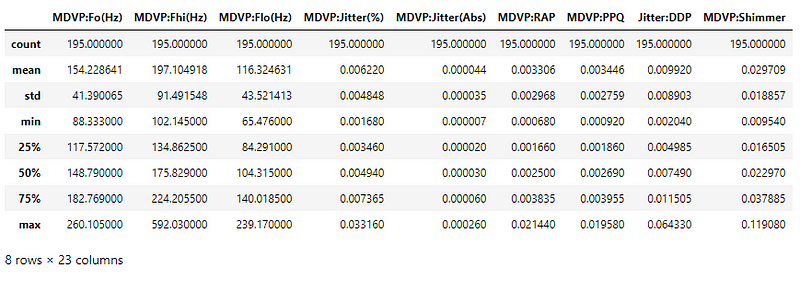
The attribute values are not of the same range, varying from ~10^-6 to ~600. These values have to be scaled before giving input to the model.
https://gist.github.com/e145cc922024036acc363518c76fb9be
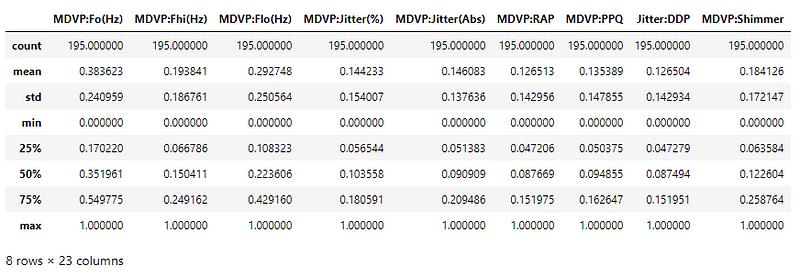
The values now lie in the range [0, 1].
One hot encoding
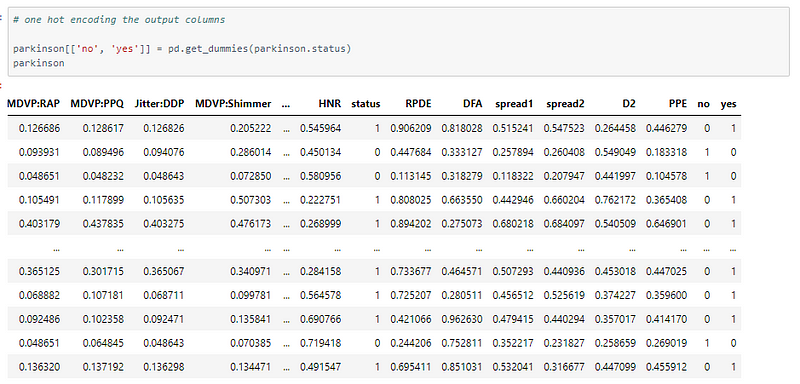
The model uses the categorical cross-entropy and thus the labels are one-hot encoded.
Sample one hot encoding: Integer value 1 → [0, 1], 0 →[1, 0].
We can keep the labels as a single integer (0/1) if we are using binary cross-entropy loss. In this case, the final layer of our model should have 1 node.
Train — test split
Using an 80–10–10 split to divide the dataset into train, validation, and test set.
The model
The model has 4 dense layers (including the input layer). The final layer has 2 nodes and softmax activation.
The softmax activation is used along with categorical cross-entropy loss when the output of the model is one-hot encoded. In the case of integer outputs, the sigmoid activation function is used along with binary cross-entropy loss and one node in the last layer.
https://gist.github.com/39651a1f4dac957b2ae38a4f66f51e50
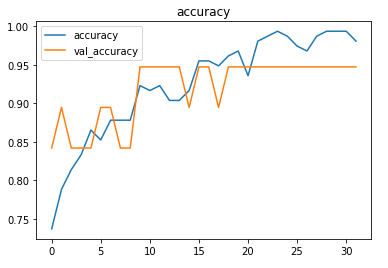
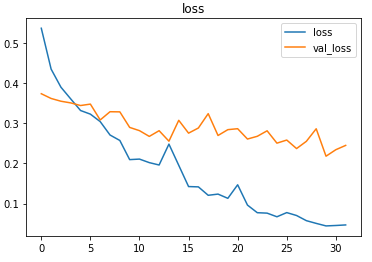
The trained model was able to achieve ~95% accuracy.

Despite the imbalance in the dataset, the confusion matrix shows promising results.
https://gist.github.com/e4ddbd5794beb3a38683e57601f54d5c

The rows indicate actual values and the columns indicate predicted values. The matrix indicates one false positive and in this case, a false positive is better than a false negative.
Plotting the metrics
Prediction
Performing predictions on random test samples.
https://gist.github.com/1d8692dd5f18ad91ddba0b5c6d5b939b

deepC
deepC library, compiler, and inference framework are designed to enable and perform deep learning neural networks by focussing on features of small form-factor devices like micro-controllers, eFPGAs, CPUs, and other embedded devices like raspberry-pi, odroid, Arduino, SparkFun Edge, RISC-V, mobile phones, x86 and arm laptops among others.
Compiling the model with deepC to get .exe file —

Head over to the cAInvas platform (link to notebook given earlier) and check out the predictions by the .exe file!
Credit: Ayisha D
Also Read: Spoken digit recognition application on cAInvasreplica rolex oyster perpetual date
