Find potential hazardous and non-hazardous near-earth asteroids.

Asteroids are small, rocky objects like mini-planets that orbit the Sun. They fall under the term planetoids that is used to describe any astronomical object that orbits the Sun that isn’t a comet.
In his final book Brief Answers to the Big Questions, Stephen Hawking considered asteroid collision to be the biggest threat to the planet. Keeping this in mind, it will be a good idea to keep track of those that are hazardous and those that aren’t.
There is increasing interest in identifying near-earth asteroids that could collide with earth if given enough time.
Implementation of the idea on cAInvas — here!
The dataset
Acknowledgment
Data-set: All the data is from the (http://neo.jpl.nasa.gov/). This API is maintained by SpaceRocks Team: David Greenfield, Arezu Sarvestani, Jason English and Peter Baunach.
The CSV file contains data about near-earth asteroids collected from NeoWs (Near-Earth Object Web Service). This is a RESTful web service where users can search for asteroids based on their closest approach date to earth.
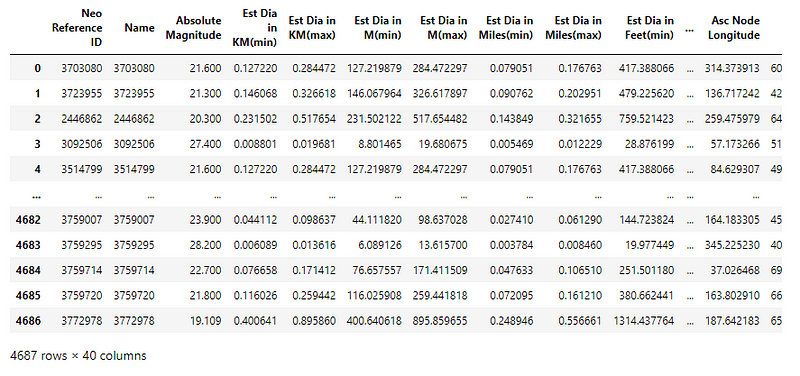
The dataset has 4686 samples, each with 39 attributes and 1 category column.
Data preprocessing
Data cleaning/Feature extraction
What are the columns in the dataset?
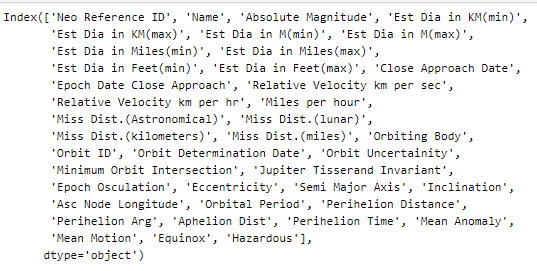
By the first look, we can see that the columns Neo Reference ID, Name, Close Approach Date, Orbit Determination Date, Orbiting Body, and Epoch Date Close Approach are not needed. Also, the Equinox column has the same value for all the rows in the dataset. These 7 columns can be dropped. (Code for analysis in the notebook).
Some columns seem to be the same value expressed using different metrics. Let’s look at the correlation between the columns —
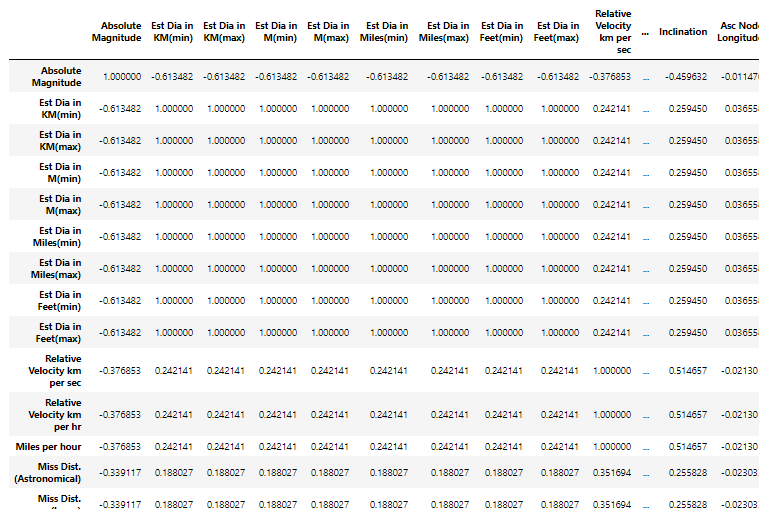
Removing the columns with high correlation values —
The dataset now has only 17 columns (almost half of the previous count). That is a lot of duplicate values in the dataset!
Converting to integer categorical variable
The datatype of the category column is boolean. Converting it to an integer to give as input to the model. We will also define an array of labels with indices corresponding to their category column values.
Dataset imbalance
Looking into the spread of values in the dataset —
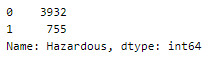
This is a highly unbalanced dataset. There are two ways to balance the dataset —
- Upsampling — Increasing the number of samples in a category by resampling them.
- Downsampling — Picking a subset of samples from the given set to use for training.
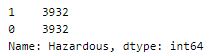
Here, we will be upsampling the categories to make their count equal to the class label with a higher count (here, 3932).
First, the dataset is separated into 2 datasets based on the category variable. The sample() function of the dataset is used with the resample parameter set to True. The resampled dataset is appended to the dataset with the higher original count to get the final dataset.
Defining the input and output columns
We define the columns of the data frame to be used as input and output for the model.
There are 16 input columns and 1 output column.
Train-test split
Splitting the dataset into training, validation, and test sets using an 80–10–10 split ratio. The datasets are then split into respective X and y arrays for further processing.
The training, validation, and test sets have 6291, 786, and 787 samples respectively.
Scaling the values
The attribute values are not of the same range. The MinMaxScaler function of the sklearn.preprocessing module is used to fit on the training set alone and use it to transform the values in the train, validation, and test sets.
The model
The model is a simple one with 4 Dense layers where the 3 initial layers use the ReLU activation function and the last one uses the Sigmoid activation function.
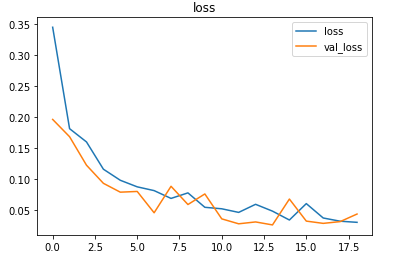
The model is compiled using the Binary cross-entropy loss function because the final layer of the model has the sigmoid activation function. The Adam optimizer is used and the accuracy of the model is tracked over epochs.
The EarlyStopping callback function monitors the validation loss and stops the training if it doesn’t for 5 epochs continuously. The restore_best_weights parameter ensures that the model with the least validation loss is restored to the model variable.
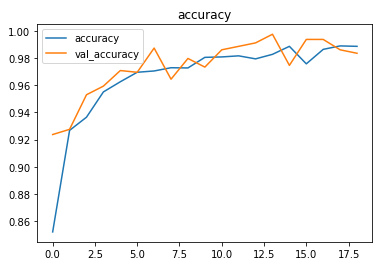
The model is trained with a learning rate of 0.001 for 128 epochs but the model stops before that due to the callbacks.
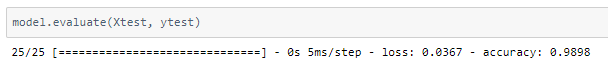
The model achieved around 98% accuracy on the test set.
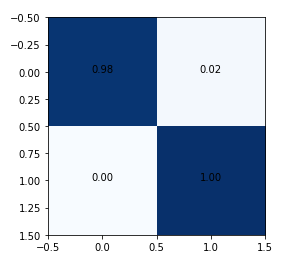
It is important to avoid false negatives (cell [1, 0] in the matrix) in these type of problems. False-negative is the classification of a hazardous asteroid as non-hazardous (that is problematic!). A larger training set will help.
The metrics
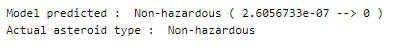
Prediction
Let’s perform predictions on random test data samples —
deepC
deepC library, compiler, and inference framework are designed to enable and perform deep learning neural networks by focussing on features of small form-factor devices like micro-controllers, eFPGAs, CPUs, and other embedded devices like raspberry-pi, odroid, Arduino, SparkFun Edge, RISC-V, mobile phones, x86 and arm laptops among others.
Compiling the model using deepC —
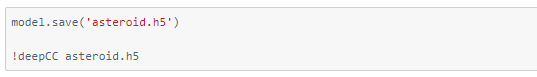
Head over to the cAInvas platform (link to notebook given earlier) and check out the predictions by the .exe file!
Credits: Ayisha D
Also Read: Question classification — on cAInvas