Predict next day rain in Australia using weather data.

A weather forecast is a prediction of how the weather will be in the coming days. Air pressure, temperature, humidity, wind, and other measurements are used by meteorologists along with other methods to predict the weather.
Predicting weather requires keen observation skills and knowledge of weather patterns. With trained deep learning models, we can identify the patterns in data to make predictions for the coming days.
Here, we use present-day weather conditions in different cities of Australia to predict rain the next day.
Implementation of the idea on cAInvas — here!
The dataset
On Kaggle by Joe Young and Adam Young
Observations were drawn from numerous weather stations. The daily observations are available from http://www.bom.gov.au/climate/data.
An example of the latest weather observations in Canberra: http://www.bom.gov.au/climate/dwo/IDCJDW2801.latest.shtml
Definitions adapted from http://www.bom.gov.au/climate/dwo/IDCJDW0000.shtml
Data source: http://www.bom.gov.au/climate/dwo/ and http://www.bom.gov.au/climate/data.
Copyright Commonwealth of Australia 2010, Bureau of Meteorology.
The dataset is a CSV file with about 10 years of daily weather observations from many locations across Australia. The various features in the dataset indicate weather-related information for the given day and RainTomorrow is the target attribute.
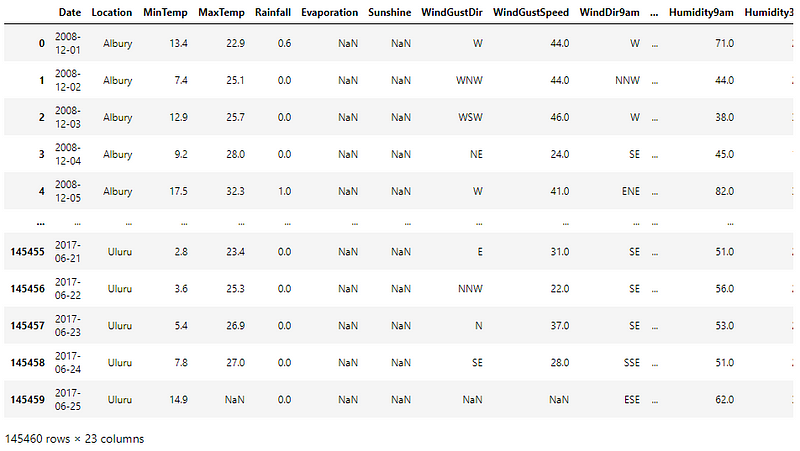
Some columns seem to have NaN values. Let’s check how many NaN values are there in the data frame.
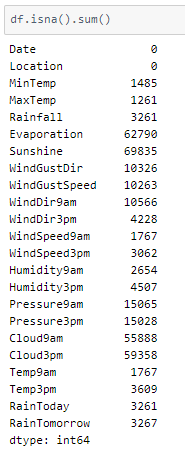
Too many NaN values! One option will be filling them but here we will be dropping them as there are too many and filling them may tint the dataset.
Preprocessing
Input attributes
Let us look into the datatypes of the attributes to go ahead with necessary processing —
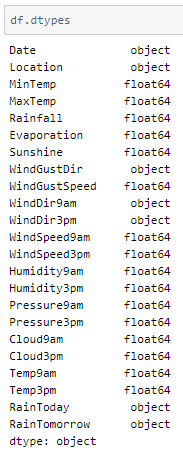
Location, WindGustDir, WindDir9am, WindDir3pm are columns whose values do not have a range dependency. The get_dummies() function of the Pandas library is used and the drop_first parameter is set to True.
This means that if there are n categories in the column, n-1 columns are returned instead of n. i.e., each value is returned as an n-1 value array. The first category is defined by an array with all 0s while the remaining n-1 category variables are arrays with 1 in the (i-1)th index of the array.
After that, the 4 columns are removed as they won’t be needed anymore.
RainToday column values can be derived from the RainfallMeasurement column and the Date value is not necessary here too. Both can be removed.
Target attribute
RainTomorrow is a binary-valued column with characters representing the two classes. Changing their data type to an integer to give as the target to the model.
Balancing the dataset
A peek into the spread of class labels across the data frame —
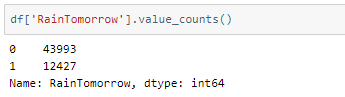
It is an unbalanced dataset. In order to balance the dataset, there are two options,
- upsampling — resample the values to increase their count in the dataset.
- downsampling — pick n samples from each class label where n = number of samples in class with least count, i.e., reducing the count of certain class values in the dataset.
Here, we will be upsampling. Resampling the values to be equal in the count can result in ~30k redundant values. So we restrict it to 20k values in class label 1, resulting in only ~8k redundant rows,
Train-validation-test split
Using an 80–10–10 ratio to split the data frame into train- validation- test sets. The train_test_split function of the sklearn.model_selection module is used for this. These are then divided into X and y (input and output) for further processing.
Standardization
Using df.describe() shows that the standard deviation of attribute values in the dataset is not the same across all of them. This may result in certain attributes being weighted higher than others. The values across all attributes are scaled to have mean = 0 and standard deviation = 1 with respect to the particular columns.
The StandardScaler function of the sklearn.preprocessing module is used to implement this concept. The instance is first fit on the training data and used to transform the train, validation, and test data.
The model
The model is a simple one with 3 Dense layers, 2 of which have ReLU activation functions and the last one has a Sigmoid activation function that outputs a value in the range [0, 1].
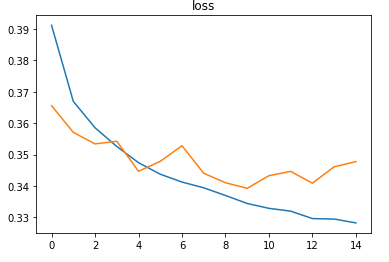
As it is a binary classification problem, the model is compiled using the binary cross-entropy loss function. The Adam optimizer is used and the accuracy of the model is tracked over epochs.
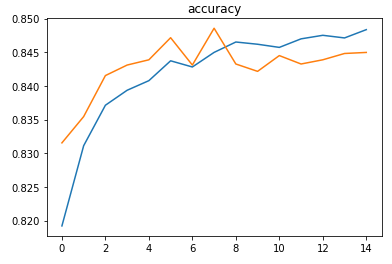
The EarlyStopping callback function of the keras.callbacks module monitors the validation loss and stops the training if it doesn’t decrease for 5 epochs continuously. The restore_best_weights parameter ensures that the model with the least validation loss is restored to the model variable.
The model was trained with a learning rate of 0.01 and achieved an accuracy of ~84.5% on the test set.
Plotting a confusion matrix to understand the results better —
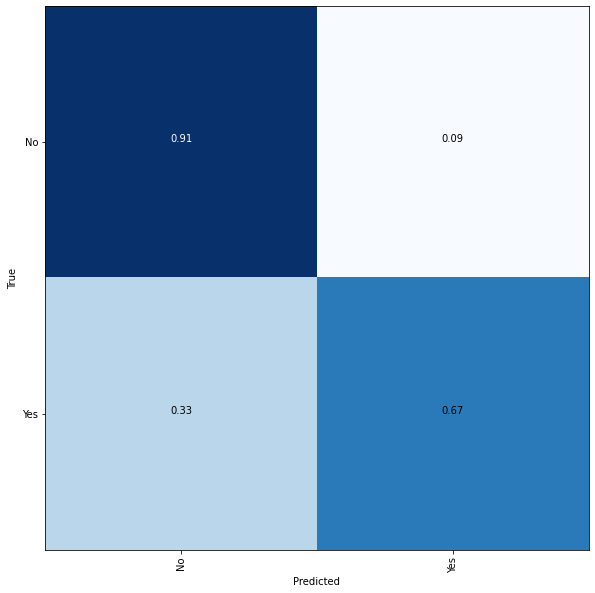
A higher count of unique values for the rain class will help in higher accuracy.
The metrics
Prediction
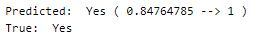
Let’s perform predictions on random test data samples —
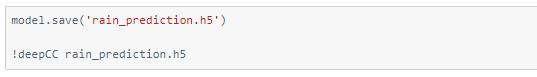
deepC
deepC library, compiler, and inference framework are designed to enable and perform deep learning neural networks by focussing on features of small form-factor devices like micro-controllers, eFPGAs, CPUs, and other embedded devices like raspberry-pi, odroid, Arduino, SparkFun Edge, RISC-V, mobile phones, x86 and arm laptops among others.
Compiling the model using deepC —
Head over to the cAInvas platform (link to notebook given earlier) and check out the predictions by the .exe file!
Credits: Ayisha D
Also Read: 3D Shape Detection System